Achievement of Marketing and Sales Performance – Market Analysis and Vision
RB0800043_8
- Last Update 03/25/2025
- File Size 0.8MB
- # of Slides 2
- File Format PPTX
- Slide Ratio 4:3
- Color
Keywords
- #Content-Based Slides
- #Design-Based Slides
- #Business Vision and Strategy
- #Market and Competitor Analysis
- #Diagram
- #Graph
- #Business Goals
- #Market Status
- #Flow
- #Circles
- #Linear Flow
- #Doughnut Chart
- #4:3
- #doughnut chart PowerPoint
- #pie chart slide template
- #performance comparison chart
- #marketing analysis PowerPoint
- #circular graph presentation
About the Product
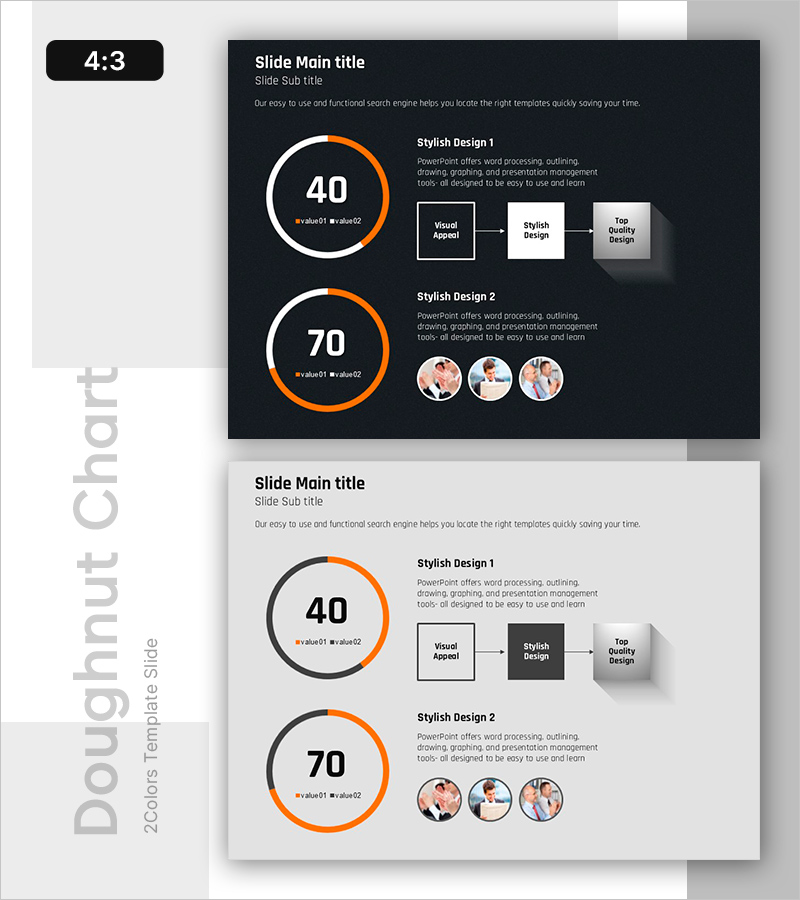
A doughnut chart PowerPoint slide designed to visually compare marketing and sales performance metrics. Two doughnut-shaped charts are positioned on a dark background with orange accent colors to intuitively display numerical comparisons and achievement rates. Each chart is accompanied by descriptive text, a three-step process flow diagram, and team member images, enabling comprehensive market analysis and vision communication within a single slide. The 4:3 aspect ratio, 2-slide format is ready for immediate editing and optimized for business presentations, strategy reports, and performance analysis documents.
Usage Points
-
Main Usage
Quantify marketing and sales performance achievement using doughnut charts, and present market analysis results alongside future vision on a single integrated slide. Enables clear communication of performance indicators in executive briefings, investor presentations, and team meetings.
-
How to Use
Input actual numerical data into the two doughnut charts and write performance analysis content in the adjacent text area. The process flow diagram and team images can be replaced or removed to match presentation context, while colors and fonts are fully customizable to align with corporate branding.
-
Recommended For
Marketing managers, sales directors, executives, and business planning teams presenting quarterly or annual performance reports, market analysis findings, and business strategy sessions. Particularly effective for presentations requiring data-driven performance analysis and strategic vision communication.
-
Slide Structure
Both slides feature identical layout: doughnut charts (2-series data visualization) on the left, title and descriptive text in upper right, three-step process flow diagram with arrows in middle right, and three circular team member images at bottom. Dark background (#1a1f2e) with orange accent color (#ff9500) throughout.
Related Products
-

Setting Goals with a Strong Foundation – Business Strategy Slide
#Business Vision and Strategy #Marketing Plan and Strategy #Diagram
-

Antique Template Goal Diagram – Business Strategy and Direction
#Business Vision and Strategy #Business Strategy #Diagram
-

Implementation Strategy and Goals – Business Flow and Cluster Structure
#Business Vision and Strategy #Diagram #Business Goals
-

Animal Performance Graphs PowerPoint Template
#Business Vision and Strategy #Business Strategy #Diagram
