Strategies for Asset Accumulation
RB0800041-1_7
- Last Update 03/25/2025
- File Size 2MB
- # of Slides 2
- File Format PPTX
- Slide Ratio 4:3
- Color
Keywords
- #Content-Based Slides
- #Design-Based Slides
- #Marketing Plan and Strategy
- #Financial Plans and Performance
- #Diagram
- #Pricing Strategy
- #Tax Strategy and Benefits
- #Flow
- #4:3
- #asset accumulation PowerPoint slide
- #financial strategy diagram
- #circular flow chart PowerPoint
- #wealth management presentation
- #how to create financial flow diagram in PowerPoint
About the Product
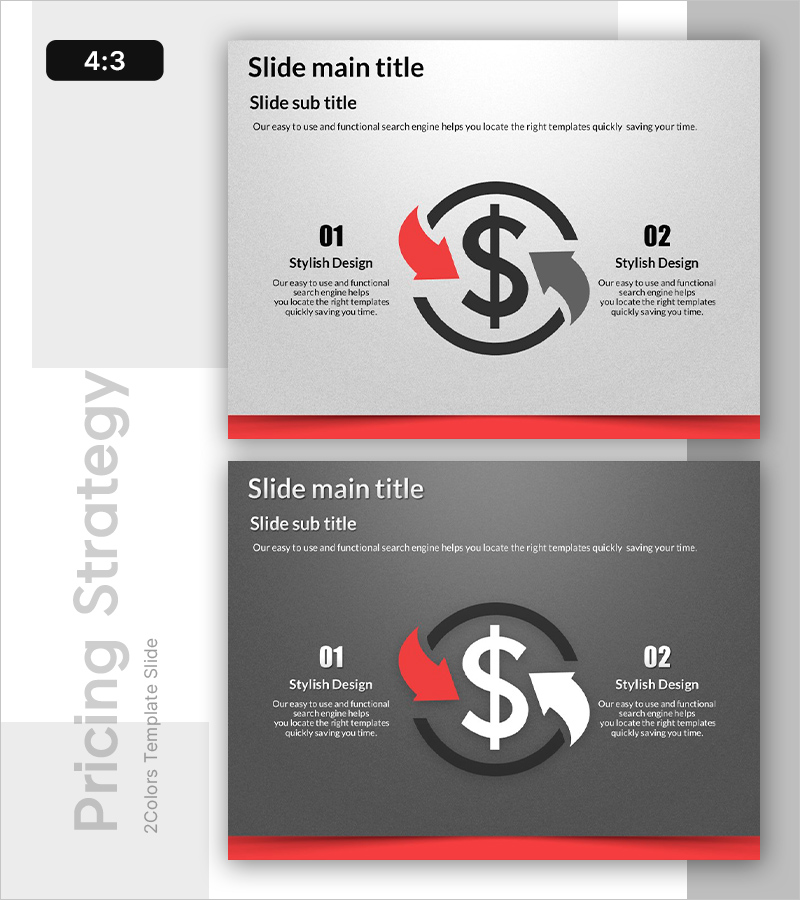
A PowerPoint slide that visualizes asset accumulation and financial strategy through a two-stage circular flow diagram. The central dollar symbol with bidirectional arrows represents capital circulation, while left and right sections provide text input areas for strategy details. Designed with a light gray background, black diagram elements, and red accent arrows, this slide is ideal for financial planning, tax strategy, and marketing presentations. Provided in 4:3 ratio PPTX format, ready for immediate editing and customization.
Usage Points
-
Main Usage
This slide effectively communicates the cyclical nature of asset accumulation and financial strategy. The central dollar symbol with bidirectional arrows illustrates continuous capital flow, enabling clear explanation of financial planning logic to investors and stakeholders.
-
How to Use
Enter specific asset accumulation strategies, financial goals, and implementation plans in the left '01 Stylish Design' and right '02 Stylish Design' sections. Add your presentation title and subtitle, then customize colors and text to match your corporate branding as needed.
-
Recommended For
Ideal for finance managers, CFOs, investment relations professionals, tax specialists, and marketing planners explaining asset management, financial planning, and investment strategies. Perfect for business plans, investor pitch decks, financial reports, and marketing strategy presentations.
-
Slide Structure
The slide consists of title and subtitle areas, a central circular flow diagram with dollar symbol and bidirectional arrows, left text box (section 01), and right text box (section 02). Optimized for expressing two-stage comparisons or cyclical processes, with independent content input areas for each section.
Related Products
-

Product Pricing Strategy Diagram – Effective Pricing Setup
#Marketing Plan and Strategy #Diagram #Pricing Strategy
-

Automotive Promotion and Pricing Strategies Slide – Market Flow Theme
#Marketing Plan and Strategy #Diagram #Pricing Strategy
-

Diagram for Setting Banking Service Objectives
#Business Vision and Strategy #Marketing Plan and Strategy #Diagram
-

Financial Planning and Investment Strategy PPT Circular Diagram
#Financial Plans and Performance #Diagram #Capital Requirements
