Free Business History Connection Diagram – Visualizing the Journey of Business
RB0800022_5
- Last Update 03/22/2025
- File Size 1MB
- # of Slides 2
- File Format PPTX
- Slide Ratio 4:3
- Color
Keywords
About the Product
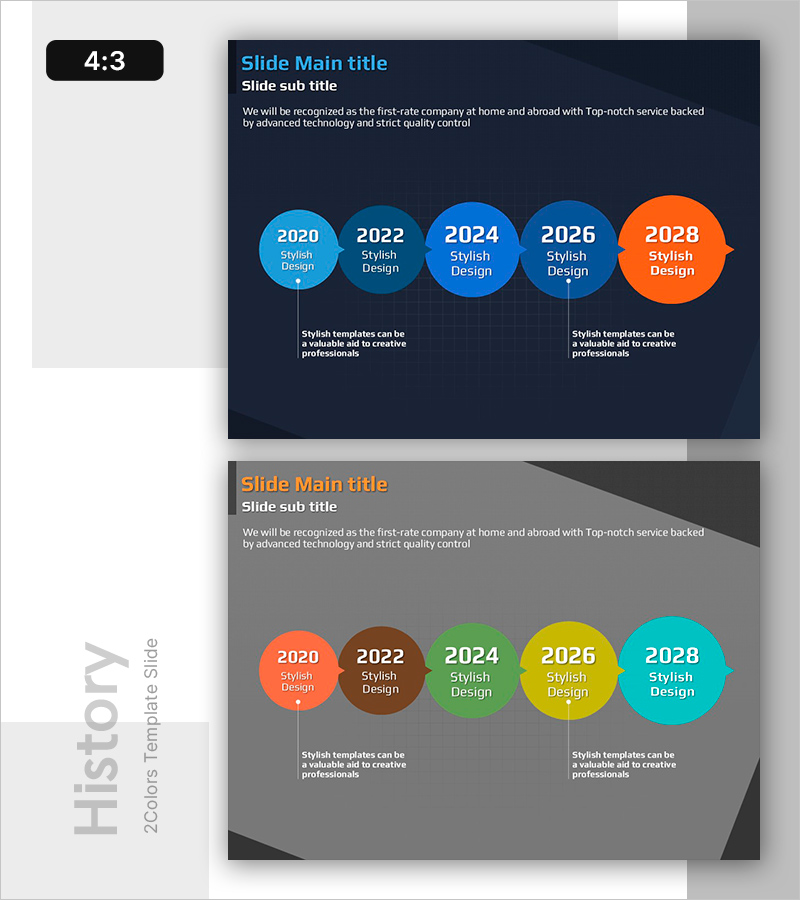
This free PowerPoint slide features a linear timeline diagram with five circle shapes connected by arrows, set against a dark navy or dark gray background. It is designed to visually organize a company's business history year by year. Each circle contains a year label and a key content area, while two supplementary text fields below the timeline allow for additional descriptions or milestone details. Two color versions are included: a dark navy background with blue and orange circle accents, and a dark gray background with multicolor circles in orange, brown, green, yellow, and teal. This presentation slide can be inserted directly into the history section of a company profile, business plan, or investor pitch deck. Simply update the year labels and text to complete the slide. The file is provided in PPTX format and is fully editable. For a wider variety of timeline and history diagram slides, explore GoodPello's premium diagram slide collection.
Usage Points
-
Main Usage
Designed to visually present a company's year-by-year business history or growth milestones using a 5-step circular timeline structure. Best suited for the history section of company profiles, business plans, and investor presentations.
-
How to Use
Replace the year labels and key content inside each circle with your actual company milestones, then add supporting descriptions in the two text fields below the timeline. Choose between the dark navy blue-orange version or the multicolor version to match your presentation style.
-
Recommended For
Recommended for corporate presenters showcasing company history, startup founders preparing pitch decks, IR managers building investor presentations, and business planners who need to visualize a company's growth journey in a single slide.
-
Slide Structure
Single-slide layout. Five circle shapes connected by directional arrows in a horizontal linear timeline. Each circle includes a year label and content text area. Two supplementary description text fields are positioned below the timeline. Two color versions included.
Related Products
-

Differentiated Core Competencies Diagrams for Business Strategy
#Free Diagrams
-

Free Service Configuration Diagram Gear Diagram – Effectively Visualizing Business Flow
#Free Diagrams
-

Basic Revenue Model Diagram – Foundations of Operations and Marketing Strategy
#Free Diagrams
-

Project Step Guide Slide – Implementing Business Strategy
#Free Diagrams
