Cluster Diagram Slide Visualizing Relationships Between Connected Items
RB0800019_7
- Last Update 03/21/2025
- File Size 2.5MB
- # of Slides 2
- File Format PPTX
- Slide Ratio 4:3
- Color
Keywords
- #Content-Based Slides
- #Design-Based Slides
- #Technical Approach
- #Diagram
- #Service Implementation Plan
- #Innovative Technologies and Future Plans
- #Cluster
- #Chain Diagram
- #4:3
- #cluster diagram PowerPoint
- #relationship diagram slide
- #connection structure diagram
- #central node visualization
- #business relationship PowerPoint template
About the Product
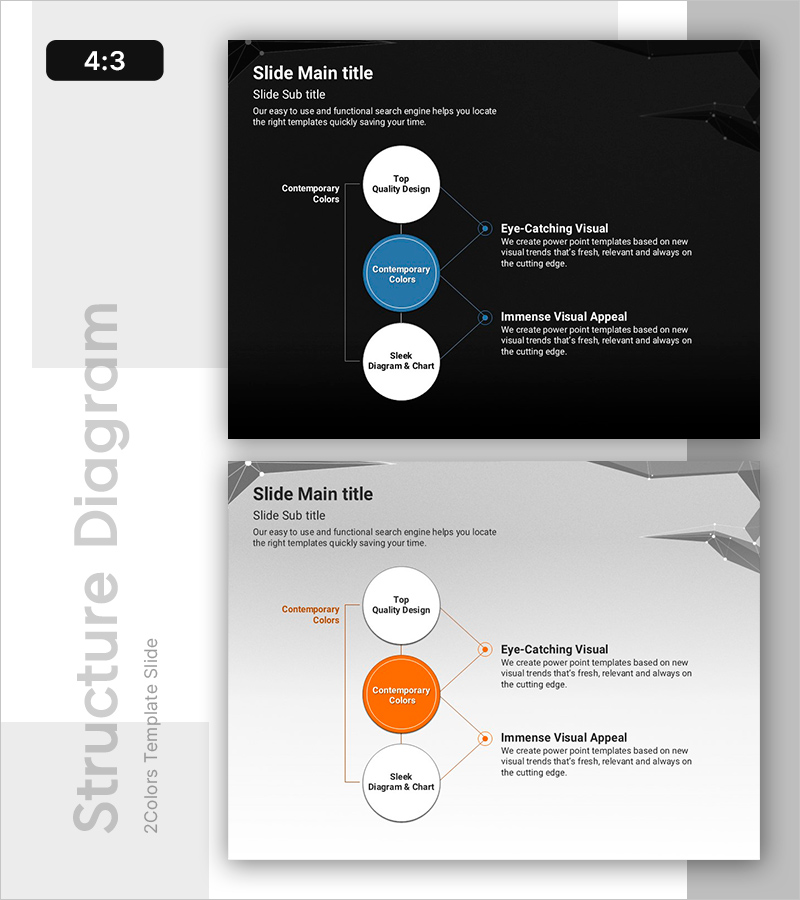
A 3-node cluster diagram PowerPoint slide that visualizes relationships between connected items through a central hub structure. Set against a dark background, the design features a blue circular node at the center connected to three white nodes positioned above, below, left, and right, clearly expressing the interaction between core concepts and surrounding elements. This 4:3 ratio, 2-slide presentation is ready to use immediately for business strategy, service development, and technology innovation presentations.
Usage Points
-
Main Usage
Optimized to visually express the interaction and relationships between a core concept (central node) and related elements (surrounding nodes). Ideal for business strategy presentations to show connections between core values and execution elements, or for service development to illustrate interdependencies between technology, personnel, and resources.
-
How to Use
Enter the core concept (e.g., service name, strategy, technology) in the central blue circular node, and place related elements (e.g., features, roles, resources) in the surrounding white nodes. Arrows and connection lines are pre-set, so you only need to edit the text for immediate presentation use. Color changes can also be applied easily.
-
Recommended For
Recommended for business strategy and business plan presentations, service development and project explanations, technology innovation introductions, organizational structure and role relationship descriptions, and customer value proposition structures. Effective for presentations to executives, employees, investors, and clients when conveying complex relationships intuitively.
-
Slide Structure
2-slide composition with the first slide featuring a dark background, a central blue node (Contemporary Colors emphasis), and three white nodes connected by straight lines positioned above, below, left, and right. The second slide presents the same structure with an orange accent node as a color variation. Each node is editable for text input, with descriptive text areas positioned on the right side.
Related Products
-

Coffee Bean Production Strategy Diagram – Innovation and Growth
#Operational Plan #Technical Approach #Diagram
-

Earth Science Topical Connectivity – In-Depth with Diagrams
#Company Introduction #Technical Approach #Diagram
-

Cluster Diagram Slide Visualizing a Scientific and Technological System
#Operational Plan #Technical Approach #Diagram
-

Earth Science Trend Rocket Map – Innovative Technologies and Future Plans
#Product/Service Introduction #Technical Approach #Diagram
