Earth Science Topical Connectivity – In-Depth with Diagrams
RJ0500035_9
- Last Update 06/16/2025
- File Size 0.4MB
- # of Slides 2
- File Format PPTX
- Slide Ratio 16:9
- Color
Keywords
- #Content-Based Slides
- #Design-Based Slides
- #Company Introduction
- #Technical Approach
- #Diagram
- #Core Values, Vision, and Mission
- #Service Implementation Plan
- #Cluster
- #Spread
- #Chain Diagram
- #Centralized Diagram
- #16:9
- #cluster diagram PowerPoint
- #central diagram slide template
- #relationship diagram
- #topic connection diagram
- #how to create cluster diagram in PowerPoint
About the Product
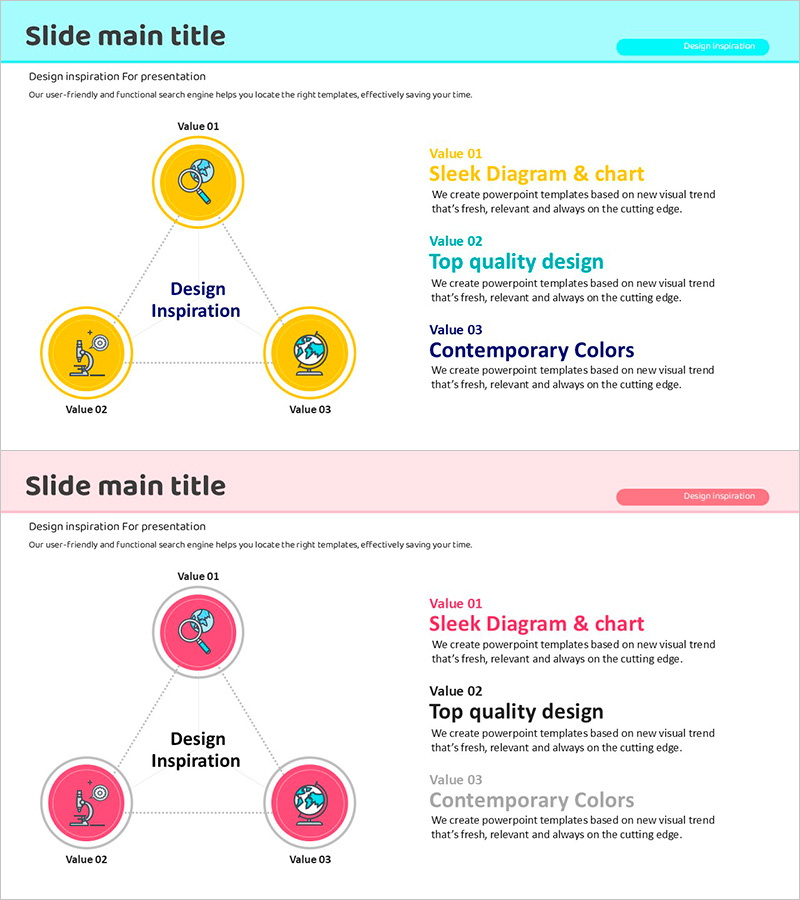
A central cluster diagram PowerPoint slide that radiates from one core concept to three related topics. The node-centered connection structure clearly expresses relationships and hierarchies between subjects. Gold-tone circular icons and dotted connectors emphasize visual flow, while the right text area accommodates detailed descriptions for each item. This presentation slide effectively communicates the relationship between core concepts and supporting elements in educational, planning, and analytical presentations.
Usage Points
-
Main Usage
Designed to connect one central concept with three related topics, allowing audiences to grasp relationships and hierarchies at a glance. Highly effective for educational settings emphasizing topic connectivity, or for planning and analytical presentations visualizing core values and supporting elements.
-
How to Use
Replace the central 'core concept' text with your presentation topic and update the three node labels with specific items. Add descriptions for each item in the right text area to enhance audience comprehension. Colors and icons can be customized to match your presentation brand.
-
Recommended For
Ideal for educators, instructors, planners, analysts, and consultants presenting learning topics, business strategies, project structures, organizational hierarchies, and market analyses. Particularly suited for presentations emphasizing inter-topic interactions and influence relationships.
-
Slide Structure
Two-slide set featuring a gold-tone background with one central node and three surrounding nodes connected by dotted lines on the first slide. The second slide provides the same layout with a pink-tone background, offering color selection options. Each node includes a circular icon area and text label, with a three-item detailed description area positioned on the right side.
Related Products
-

Business Area Hexagon Diagram – Business Positioning
#Company Introduction #Business Introduction #Diagram
-

AI Efficiency Value PowerPoint Slide – 4-Bubble KPI Layout
#Company Introduction #Business Vision and Strategy #Business Strategy
-

Expected Impact and Conclusion Slide for Sustainable Urban Development
#Company Introduction #Business Vision and Strategy #Text Box
-

Collaborative Business Diagram – Business Strategy and Goals
#Company Introduction #Business Vision and Strategy #Diagram
