Basic Data Visualization Slide – Practical Approach
RB0800016_14
- Last Update 03/20/2025
- File Size 2.7MB
- # of Slides 2
- File Format PPTX
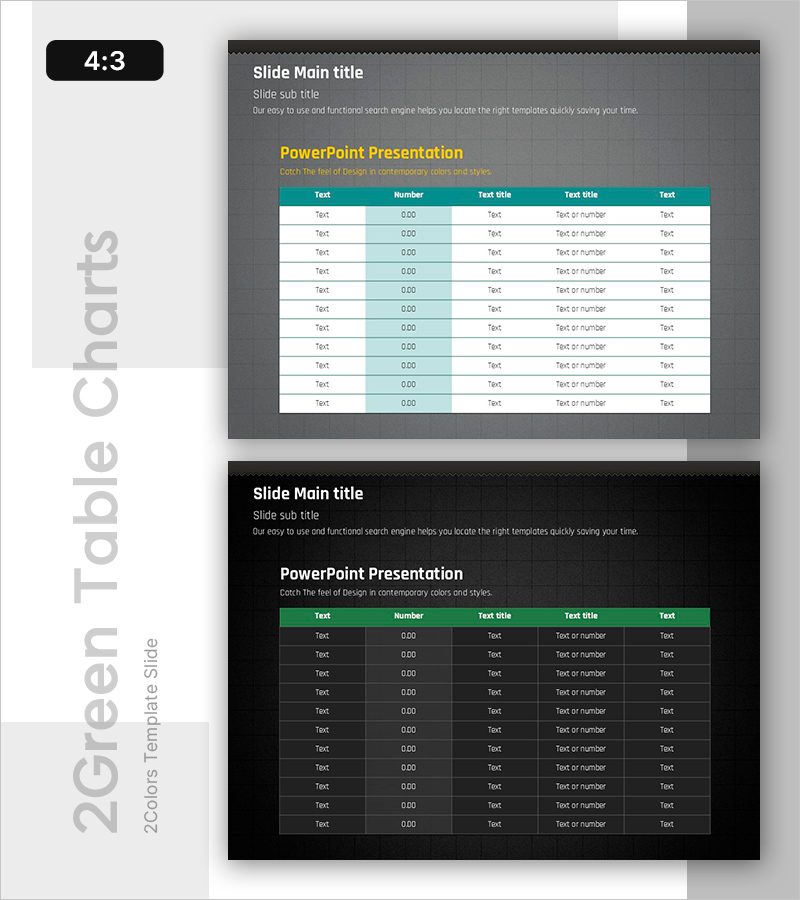
- Slide Ratio 4:3
Keywords
About the Product
A professional PowerPoint slide designed for presenting numerical data in financial reports, market analysis, and business plans. Features a dark gray background with a teal-colored table header that accommodates 10+ rows of data in a structured five-column layout. The upper section includes dedicated areas for main title, subtitle, and descriptive text, with a yellow accent line for highlighting key insights. The 4:3 aspect ratio template comes in a 2-slide set ready for immediate editing. Ideal for CFOs, analysts, and consultants who need to visualize financial metrics, statistical comparisons, and performance data with clarity and impact.
Usage Points
-
Main Usage
Present numerical data systematically in financial reports, market analysis, and business plans. The multi-column table structure allows stakeholders, investors, and executives to compare metrics and identify trends at a glance, enhancing credibility and decision-making.
-
How to Use
Enter your presentation topic in the title and subtitle fields at the top. Add key insights in the yellow accent text area. Fill the table header with column names and populate rows with your data. The dark background ensures excellent readability during projector presentations and online meetings.
-
Recommended For
Finance teams presenting quarterly earnings, marketing departments analyzing customer metrics and market share, executives delivering business performance reports, and consultants preparing data-driven proposals. Suitable for any business presentation requiring numerical comparison and trend analysis.
-
Slide Structure
Upper section: main title, subtitle, and descriptive text (3 levels) / Central accent: yellow highlight text / Lower table: 5 columns (Text, Number, Text title, Text title, Text) × 11 rows for flexible data entry.
Related Products
-

Campaign Goals & Funnel Outcomes Slide – Blue & Green
#Business Strategy #Marketing Plan and Strategy #Diagram
-

Product Roadmap PowerPoint Slide – Q1 to Q4 Launch Matrix
#Product/Service Introduction #Business Strategy #Development Plan
-

Sales Strategy PowerPoint Slide – 4-Framework Client Hub
#Product/Service Introduction #Business Vision and Strategy #Diagram
-

Business Outcome PowerPoint Slide – 3-Circle Solution Hub
#Company Introduction #Business Strategy #Diagram
