Campaign Goals & Funnel Outcomes Slide – Blue & Green
RBTK0600001
- Last Update 05/06/2026
- File Size 12.2MB
- # of Slides 2
- File Format PPTX
- Slide Ratio 16:9
- Color
Keywords
- #Content-Based Slides
- #Design-Based Slides
- #Business Strategy
- #Marketing Plan and Strategy
- #Diagram
- #Financial Outlook & Expected Impact
- #Marketing Strategy
- #Structure
- #Pyramid Chart
- #16:9
- #campaign goals funnel metrics PowerPoint slide
- #marketing funnel presentation template
- #campaign outcomes slide deck light theme
- #SaaS marketing plan PowerPoint slide
- #funnel stage metrics presentation slide
About the Product
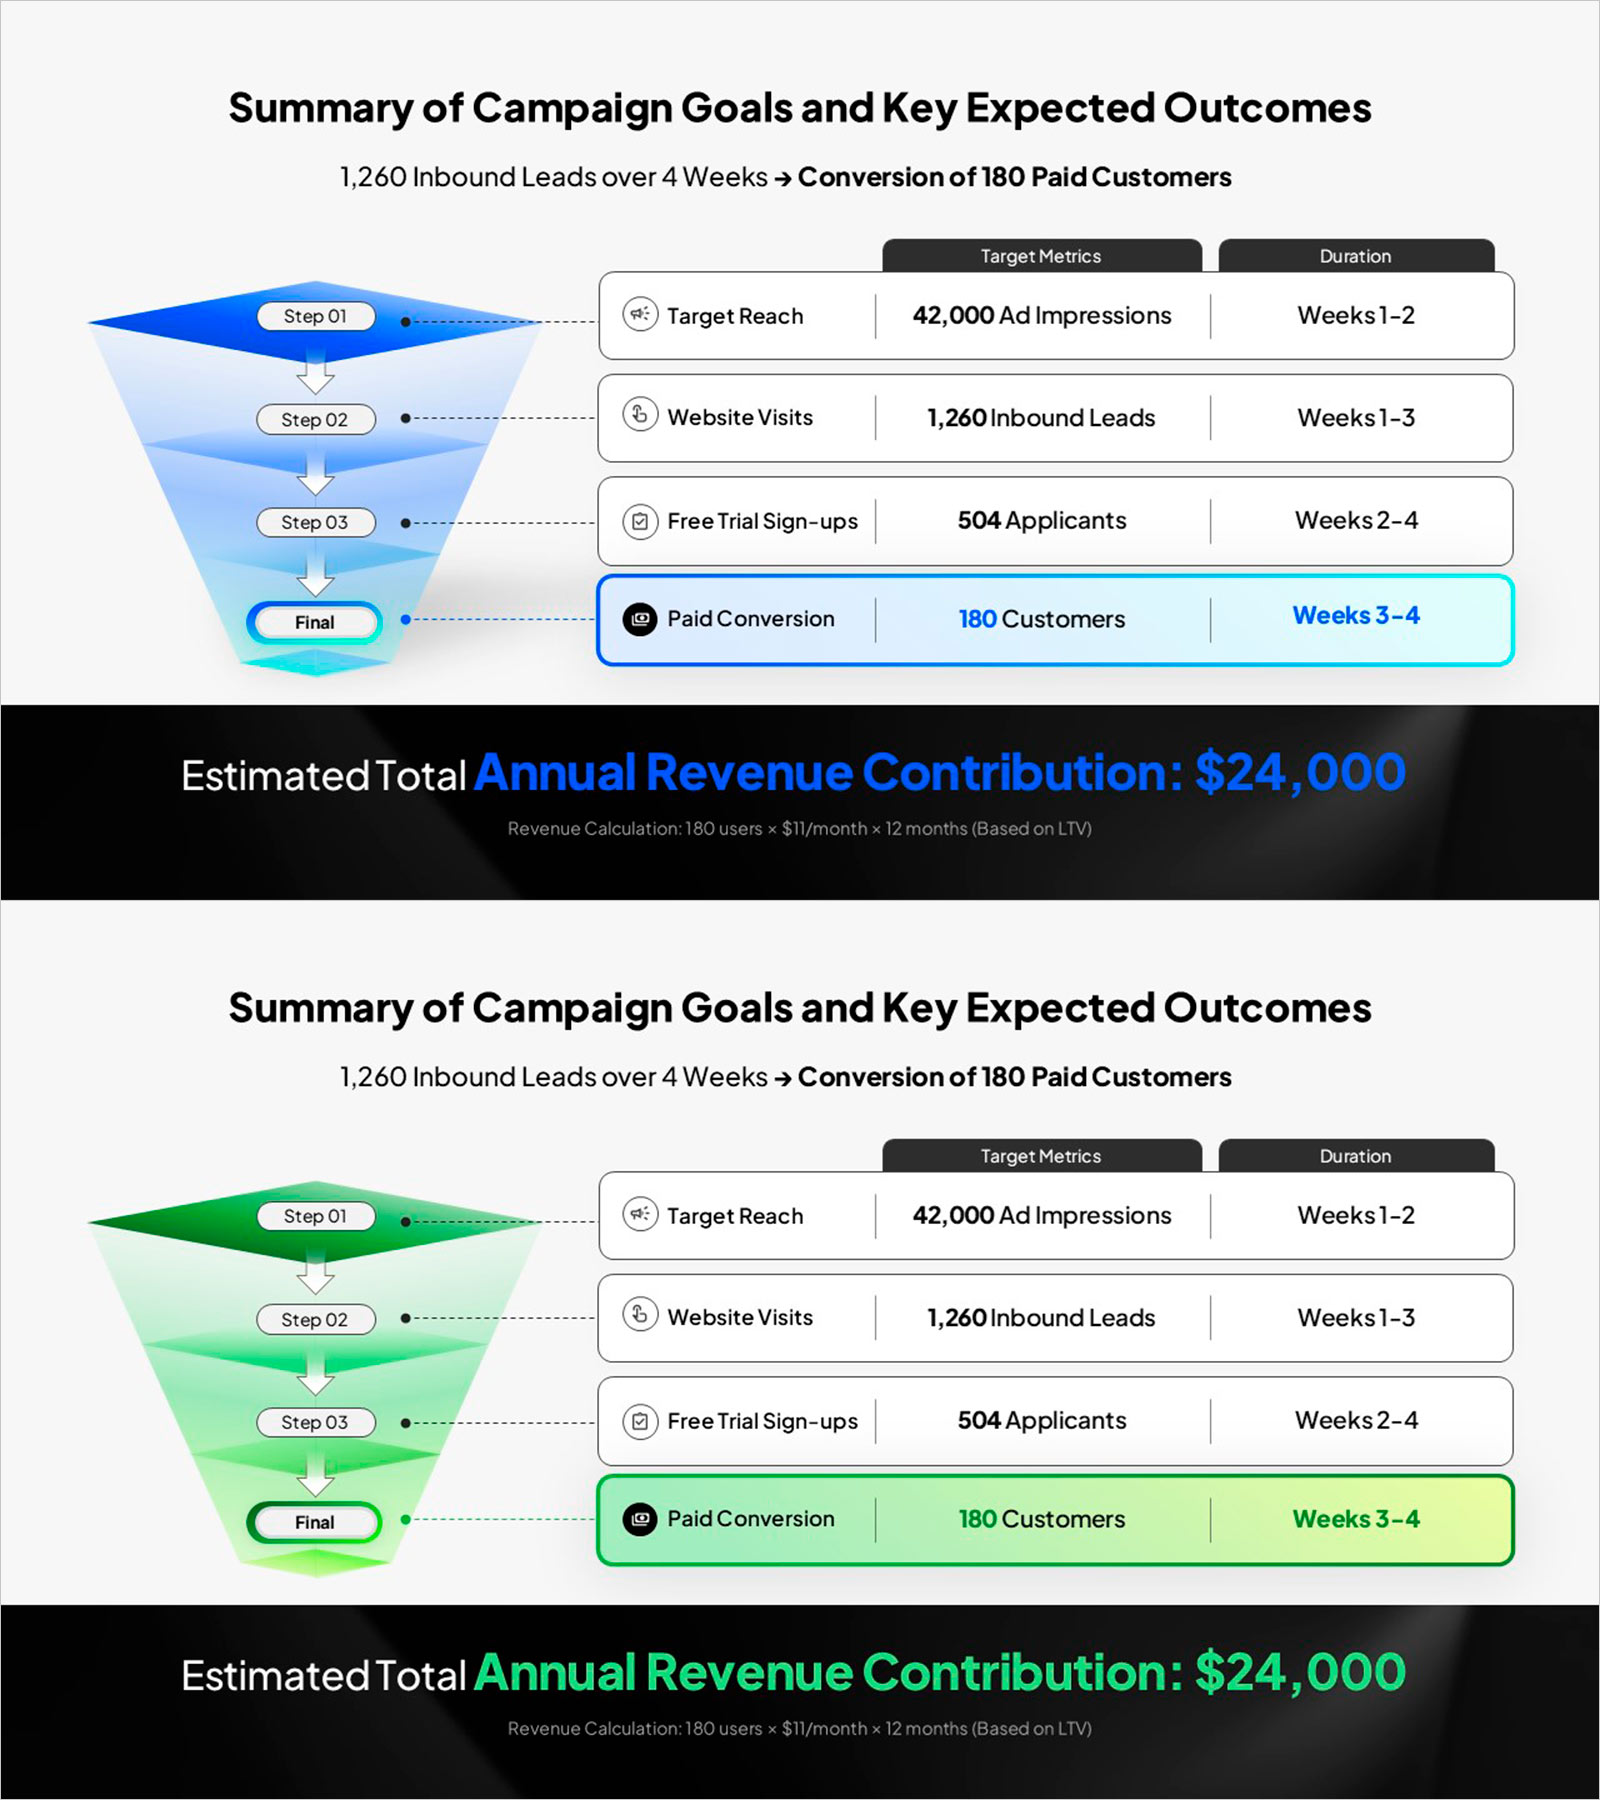
Campaign goals and funnel metrics PowerPoint slide with a four-stage funnel diagram and a stage-by-stage metrics table. The left panel displays an inverted funnel (Step 01 through Final). The right table maps each stage to target metrics and duration: Target Reach (42,000 ad impressions, Weeks 1–2), Website Visits (1,260 inbound leads, Weeks 1–3), Free Trial Sign-ups (504 applicants, Weeks 2–4), and Paid Conversion (180 customers, Weeks 3–4, highlighted). A dark footer banner emphasizes the estimated annual revenue contribution of $24,000 (180 users × $11/month × 12 months, LTV-based). Light background in blue-accent and green-accent color variants. Editable in PowerPoint for startup and SaaS marketing plans, campaign reports, and business plan presentations.
Usage Points
-
Main Usage
Use as the marketing campaign summary in startup and SaaS pitch decks and marketing plans. Presents funnel stage targets, duration, and annual revenue projection in one PowerPoint slide.
-
How to Use
Replace funnel stage labels, table metrics, and duration data with your campaign targets. Update the dark footer revenue calculation with your LTV-based figures in PowerPoint.
-
Recommended For
Ideal for SaaS and startup marketing teams, founders, and business development managers presenting campaign goals and expected outcomes to investors and management.
-
Slide Structure
One slide. Title and subheadline. Left: inverted four-stage funnel. Right: four-row table with icons and duration. Dark footer with annual revenue estimate. Blue and green versions.
Related Products
-

Strategic Planning Through the Pyramid of Goals
#Marketing Plan and Strategy #Diagram #Marketing Objectives
-

Idea Presentation Template Wide Pyramid Diagram
#Marketing Plan and Strategy #Diagram #Marketing Strategy
-

Stylish Pyramid Structure Presentation Slide Template – Elegance and Efficiency
#Marketing Plan and Strategy #Diagram #Marketing Objectives
-

Business Strategy 3D Cylinder Diagram – Visualization of Business Vision and Strategy
#Business Vision and Strategy #Marketing Plan and Strategy #Diagram
