Infographic Slide for Introducing Visual Trends
RB0800016_13
- Last Update 03/20/2025
- File Size 2.7MB
- # of Slides 2
- File Format PPTX
- Slide Ratio 4:3
Keywords
About the Product
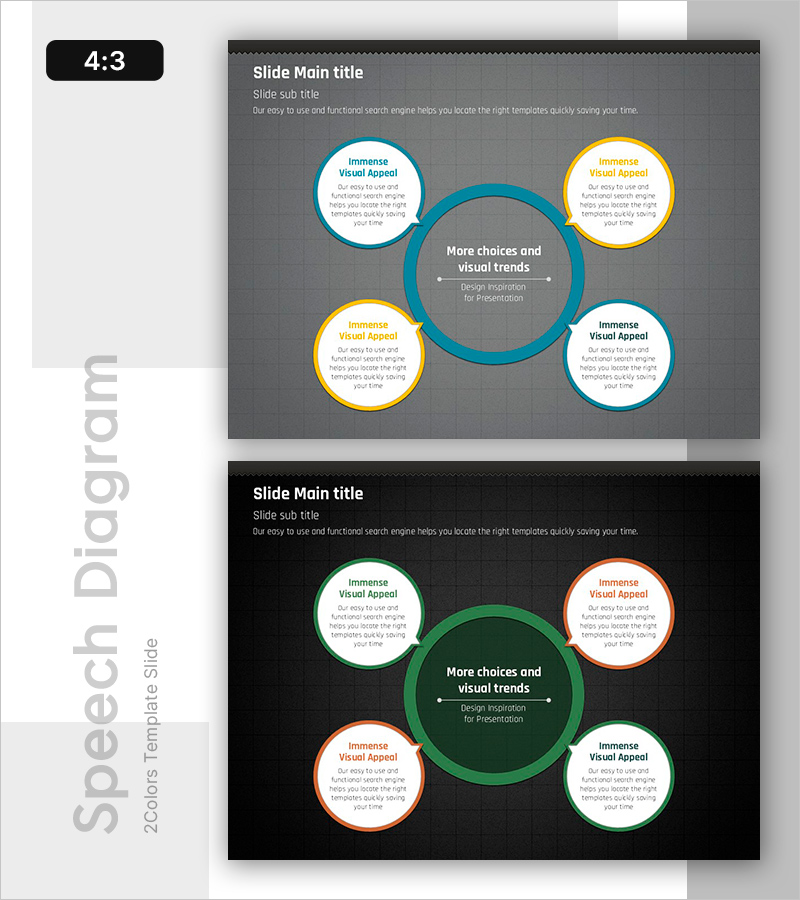
A comparison-style infographic PowerPoint slide featuring a central circle surrounded by four circular elements arranged in a balanced layout. Ideal for presenting four key concepts, strategies, or product features simultaneously while emphasizing their relationship to a central theme. The dark gray background with teal and gold circle borders creates clear visual distinction, and each section accommodates title, description, and icon placement. The 2-slide set offers multiple color combinations (teal/gold and green/orange) to match your presentation topic and brand colors. Perfect for business proposals, marketing presentations, and strategic planning decks where multi-faceted analysis needs clear visual communication.
Usage Points
-
Main Usage
Simultaneously compare four concepts, items, or strategies while establishing visual connection to a central message. Commonly used for marketing strategy analysis, product positioning, competitive comparison, and visual trend presentation where multi-angle analysis requires clear information hierarchy.
-
How to Use
Enter your core topic in the central circle (e.g., 'More choices and visual trends'), then add comparison item titles and descriptions in each of the four outer circles. The color-coded borders automatically distinguish sections without additional formatting. Adjust font sizes based on text length to maintain readability throughout.
-
Recommended For
Marketing professionals, strategic planning teams, product development managers, and executives preparing presentation materials. Particularly effective for presentations requiring equal-weight comparison of four options, perspectives, or alternatives to support decision-making.
-
Slide Structure
2-slide set. Each slide contains one central circle (1-2 lines of text) plus four outer circles (each with title line plus 3-4 lines of description). First slide features teal and gold color scheme; second slide uses green and orange for design variety and flexibility.
Related Products
-

Business Outcome PowerPoint Slide – 3-Circle Solution Hub
#Company Introduction #Business Strategy #Diagram
-

AI Efficiency Value PowerPoint Slide – 4-Bubble KPI Layout
#Company Introduction #Business Vision and Strategy #Business Strategy
-

Brand vs. Competitor Messaging Slide – 3-Point, Blue & Green
#Product/Service Introduction #Market and Competitor Analysis #Benefits and Advantages
-

Sales Strategy PowerPoint Slide – 4-Framework Client Hub
#Product/Service Introduction #Business Vision and Strategy #Diagram
