AI Efficiency Value PowerPoint Slide – 4-Bubble KPI Layout
RBTK0500001_6
- Last Update 05/04/2026
- File Size 12.5MB
- # of Slides 2
- File Format PPTX
- Slide Ratio 16:9
- Color
Keywords
- #Content-Based Slides
- #Design-Based Slides
- #Company Introduction
- #Business Vision and Strategy
- #Business Strategy
- #Diagram
- #Core Values, Vision, and Mission
- #Core Competencies
- #Achievements
- #Cluster
- #Chain Diagram
- #16:9
- #AI efficiency KPI PowerPoint slide
- #operational cost reduction presentation template
- #decision speed improvement slide deck
- #AI bottleneck removal PowerPoint
- #business efficiency metrics bubble chart presentation
About the Product
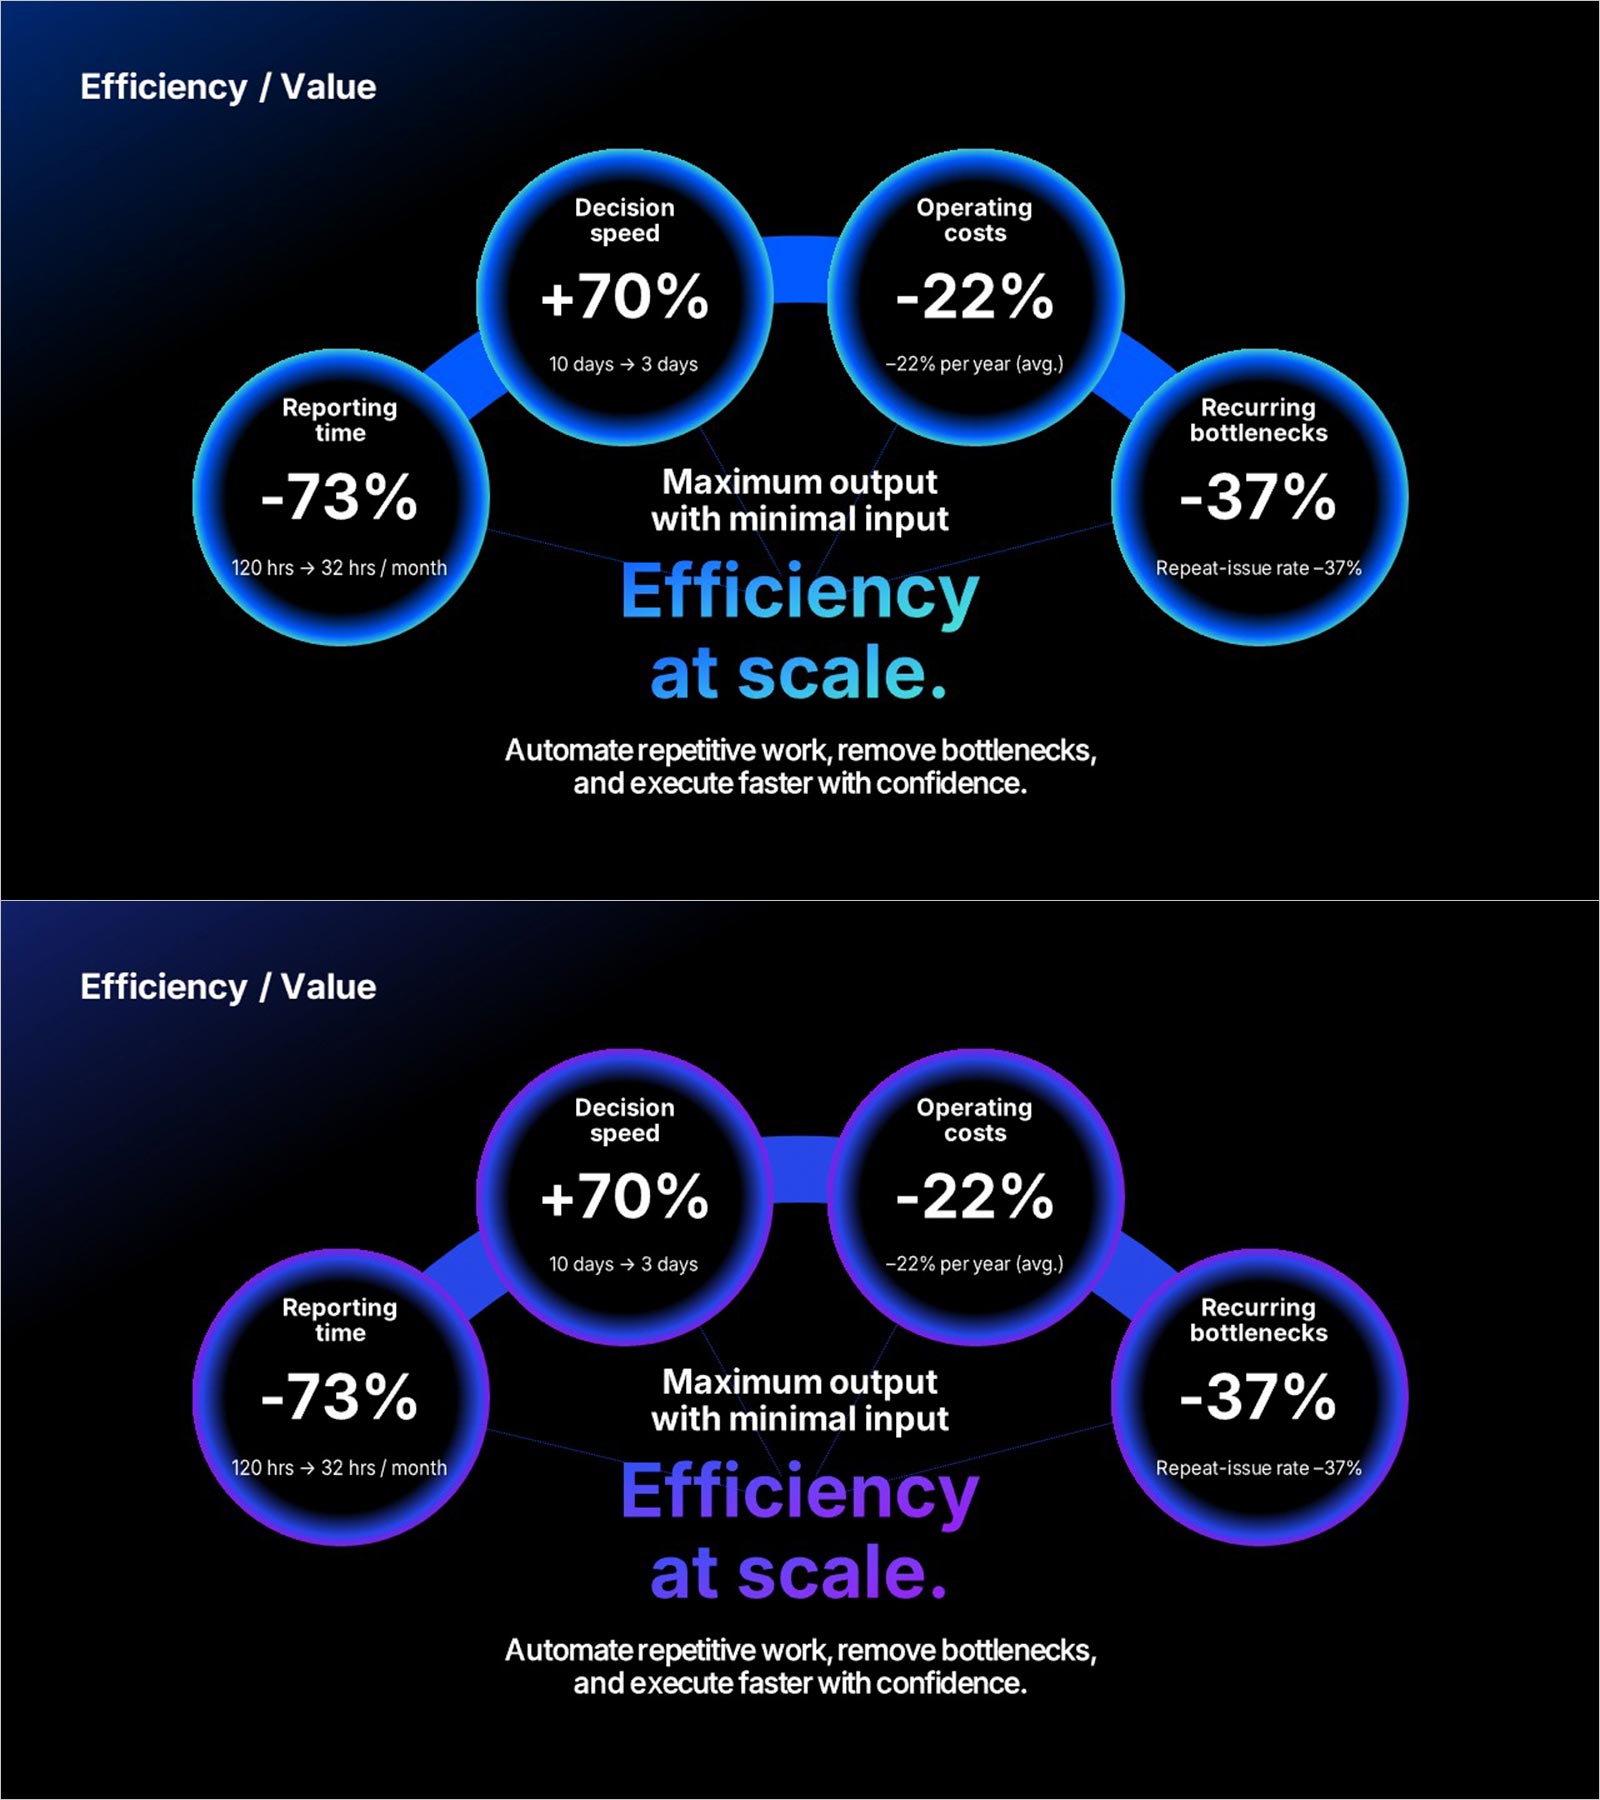
AI operational efficiency PowerPoint slide with four radial KPI bubbles. Metrics: Decision Speed (+70%, 10 to 3 days), Operating Costs (-22% avg. yearly), Reporting Time (-73%, 120 to 32 hrs/month), Recurring Bottlenecks (-37% repeat rate). Central "Efficiency at scale." headline with "Maximum output with minimal input" subheadline and Efficiency / Value label at the top. Dark background in blue-glow and purple-glow bubble versions. Editable in PowerPoint for AI pitch decks, investor IR, and operational efficiency reports.
Usage Points
-
Main Usage
Use as the efficiency outcomes section in AI solution pitch decks and IR presentations. Presents four radial KPI metrics from AI bottleneck removal on one PowerPoint slide.
-
How to Use
Replace the four bubble KPI values, comparison figures, and labels with your operational data. Edit the central headline, subheadline, and Efficiency / Value label in PowerPoint.
-
Recommended For
Ideal for AI startup founders, operations leads, and product managers presenting quantified efficiency gains from AI automation to investors, executives, and enterprise clients.
-
Slide Structure
One slide. Label and headline at top. Four radial KPI bubbles: +70% decision speed, -22% operating costs, -73% reporting time, -37% recurring bottlenecks. Dark background in blue and purple versions.
Related Products
-

Idea Core Competency Connection Diagram – A Fusion of Vision and Strategy
#Company Introduction #Business Vision and Strategy #Diagram
-

Core Competency Analysis Diagram – Structural and Cluster-based
#Product/Service Introduction #Business Vision and Strategy #Diagram
-

Visualize Business Vision and Strategy with Puzzle Donut Diagram
#Product/Service Introduction #Business Vision and Strategy #Diagram
-

Water Resources Utilization Diagram Template
#Product/Service Introduction #Business Vision and Strategy #Diagram
