Eye-Catching Bar Graph Slide – Easy and Fast Data Analysis
RB0800015_9
- Last Update 03/20/2025
- File Size 0.3MB
- # of Slides 2
- File Format PPTX
- Slide Ratio 4:3
Keywords
About the Product
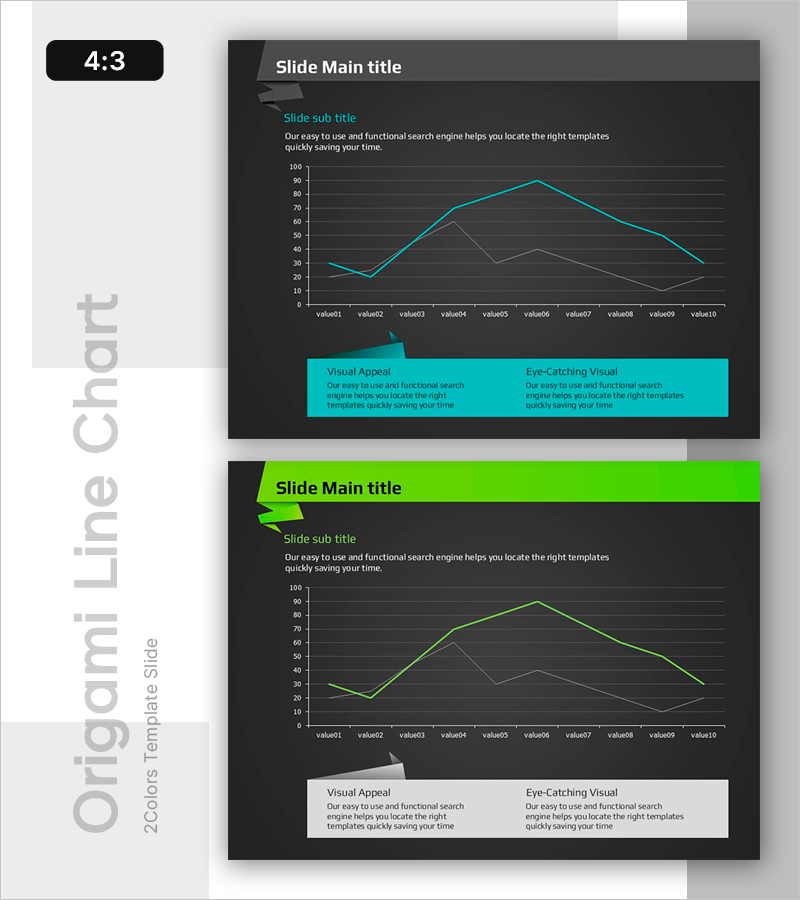
A 2-slide PowerPoint presentation designed for data analysis and performance reporting. Features a dark background with lime green and cyan dual-line graphs displaying 10 data points each, enabling clear comparison of two data series. Each slide includes a title and subtitle area, a multi-point line chart, and two side-by-side text boxes for insights. Ideal for market analysis, financial reporting, quarterly performance reviews, and investor presentations requiring visual data comparison.
Usage Points
-
Main Usage
Visualize time-series data across two comparable metrics—such as market trends, quarterly performance, or financial indicators—using contrasting lime green and cyan lines. The dual-line format enables immediate visual comparison, while side-by-side text boxes provide space for analytical insights and strategic implications.
-
How to Use
Apply this slide in business reports, investor presentations, and marketing analysis decks. Replace chart data with your actual figures (quarterly sales, market share trends, budget vs. actual, etc.), then populate the text boxes with key findings and recommendations. The 4:3 aspect ratio ensures compatibility with standard presentation systems.
-
Recommended For
Finance teams, marketing departments, executive leadership, quarterly business reviews, investor relations meetings, and market analysis seminars. Particularly effective when comparing two performance metrics or demonstrating competitive positioning over time.
-
Slide Structure
Each slide contains a title/subtitle section at the top, a dual-line chart in the center (10 data points per series), and two text input boxes at the bottom (approximately 150 characters each). Formatted in 4:3 ratio for broad compatibility with existing presentation frameworks.
Related Products
-

Contact Closing PowerPoint Slide – Interior Dark Two-Column
#Company Introduction #Contact Information
-

Plogging Route Presentation Slide – 9-Point S-Curve Timeline
#Company Introduction #Business Strategy #Corporate Social Responsibility
-

Customer Reviews PowerPoint Slide – Photo Grid Speech Bubble
#Customer Success Stories #Text Box #Customer Testimonials and Feedback
-

Project Overview PowerPoint Slide – 4-Spec Dark Real Estate
#Product/Service Introduction #Business Strategy #Diagram
