Vertical Bar Chart Slide for Data Comparison – Forward-thinking
RB0800015_7
- Last Update 03/20/2025
- File Size 0.3MB
- # of Slides 2
- File Format PPTX
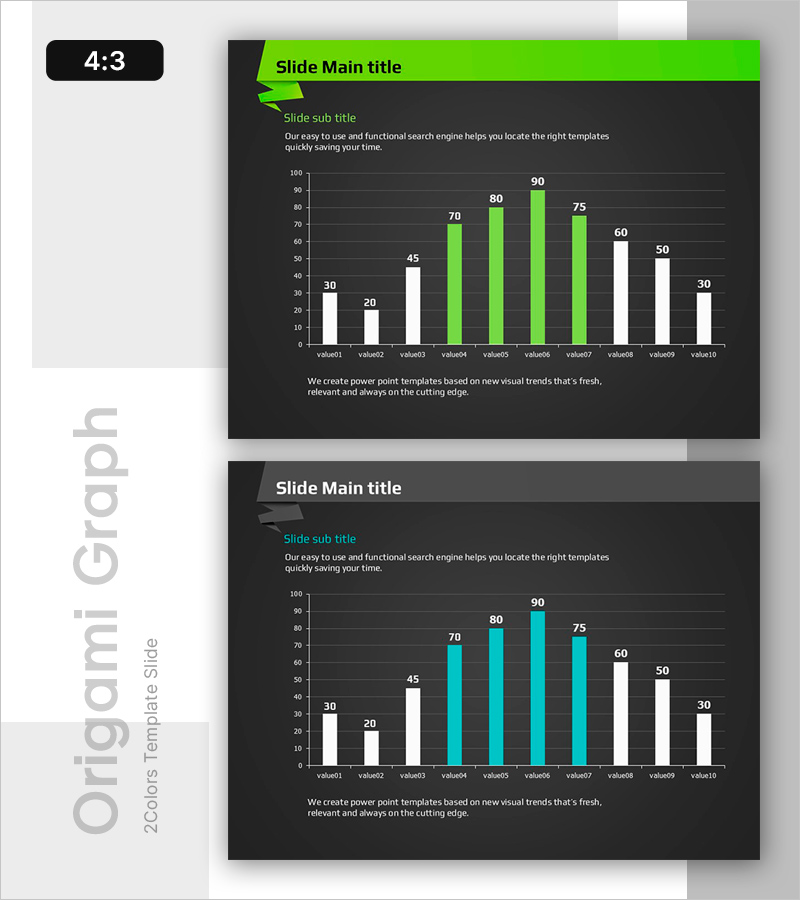
- Slide Ratio 4:3
Keywords
About the Product
A vertical bar chart PowerPoint slide designed for data comparison and analysis. The dark background contrasts lime green and white bars to emphasize key metrics, optimized for comparing 10 data points. The slide features a title and subtitle area at the top with descriptive text space, and an insight section at the bottom for additional context. Available in 4:3 aspect ratio PPTX format with 2 slide variations, ready for immediate editing and use.
Usage Points
-
Main Usage
Compare multiple data points across quarters, months, regions, or categories to visualize performance trends and outcomes. The lime green accent bar highlights peak values, making decision-making evidence clear and impactful.
-
How to Use
Enter your analysis topic in the title and subtitle fields, then replace the chart values with your actual data. Add insights or conclusions in the bottom text area to enhance audience comprehension and engagement.
-
Recommended For
Ideal for financial reports, business analysis presentations, marketing performance reviews, and investor pitch meetings. Recommended for executives, data analysts, and marketing professionals who need to communicate quantitative findings effectively.
-
Slide Structure
Two-slide set with the first featuring lime green accent bars and the second with cyan blue accent bars for design variation. Each slide includes title (1 line), subtitle (1 line), descriptive text (2-3 lines), a 10-item vertical bar chart, and an insight statement area at the bottom.
Related Products
-

Plogging Route Presentation Slide – 9-Point S-Curve Timeline
#Company Introduction #Business Strategy #Corporate Social Responsibility
-

F&B Menu PowerPoint Slide – Circular 4-Step Process Layout
#Operational Plan #Diagram #Business Processes
-

Sales Strategy PowerPoint Slide – 4-Framework Client Hub
#Product/Service Introduction #Business Vision and Strategy #Diagram
-

Project Overview PowerPoint Slide – 4-Spec Dark Real Estate
#Product/Service Introduction #Business Strategy #Diagram
