Standard Table for Data Visualization – Reliable Information Delivery
RB0800015_17
- Last Update 03/20/2025
- File Size 0.3MB
- # of Slides 2
- File Format PPTX
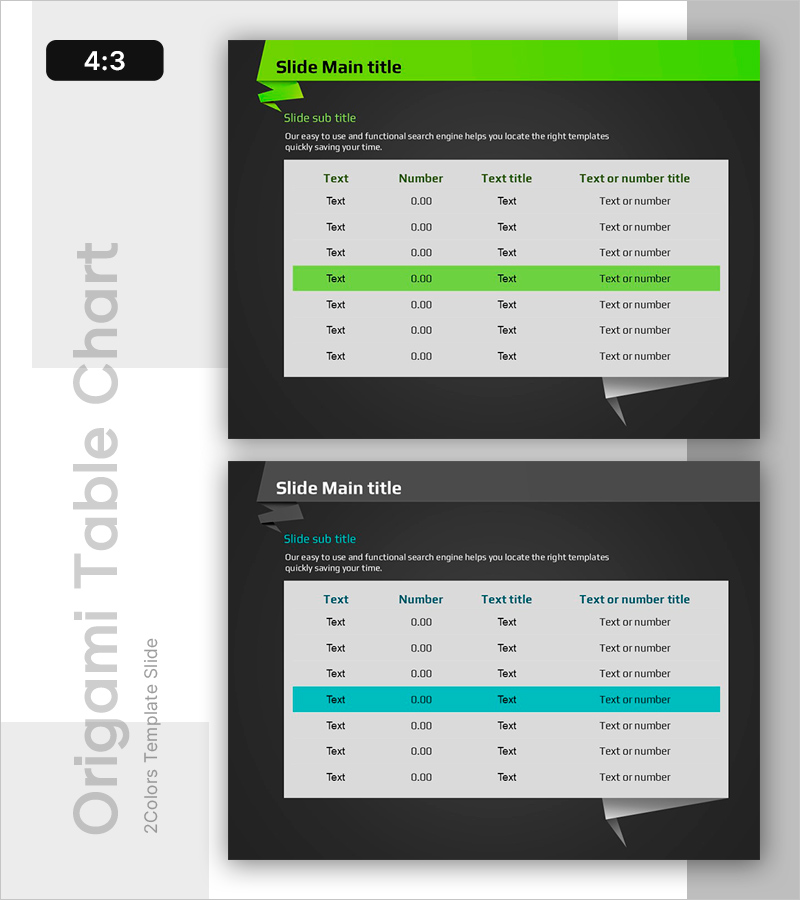
- Slide Ratio 4:3
Keywords
About the Product
A professional table-format PowerPoint slide designed to present financial data, market analysis, and performance metrics with clarity and impact. The slide features a dark background with lime green accent row highlighting critical information, organized in four columns (Text, Number, Text title, Text or number title) for structured data presentation. The 2-slide set allows multiple datasets to be displayed using the same layout, with 4:3 aspect ratio compatible with standard presentation environments. Ideal for financial reports, investor presentations, executive briefings, and business analysis decks.
Usage Points
-
Main Usage
Present quantitative information such as financial metrics, market data, and performance figures in structured table format. The lime green accent row emphasizes key data points to focus audience attention, while the 4-column structure systematically organizes text, numbers, titles, and descriptions for maximum clarity.
-
How to Use
Use in investor presentations, executive meetings, quarterly performance reports, and market analysis briefings as your data comparison section. Fill each row to illustrate numeric trends, departmental performance, competitive benchmarking, or other comparative metrics. The 2-slide set enables presentation of multiple datasets in sequence.
-
Recommended For
Finance teams, executives, marketing professionals, and sales teams preparing regular reports and analytical materials. Particularly suited for income statements, budget status, market share analysis, customer satisfaction metrics, and data-driven decision-making presentations.
-
Slide Structure
Each slide contains a title area with lime green header bar, subtitle section, descriptive text, and a 4-column table (Text, Number, Text title, Text or number title). The table has 7 rows total: 1 header row plus 6 data rows, with the 4th row highlighted in lime green to emphasize important items.
Related Products
-

F&B Menu PowerPoint Slide – Circular 4-Step Process Layout
#Operational Plan #Diagram #Business Processes
-

Market Demand Analysis PowerPoint Slide – Donut Chart Layout
#Market and Competitor Analysis #Graph #Customer Analysis
-

Plogging Route Presentation Slide – 9-Point S-Curve Timeline
#Company Introduction #Business Strategy #Corporate Social Responsibility
-

Customer Reviews PowerPoint Slide – Photo Grid Speech Bubble
#Customer Success Stories #Text Box #Customer Testimonials and Feedback
