Structure and Flow of 6 Key Components Diagram Slide
RB0800014_17
- Last Update 03/20/2025
- File Size 0.1MB
- # of Slides 2
- File Format PPTX
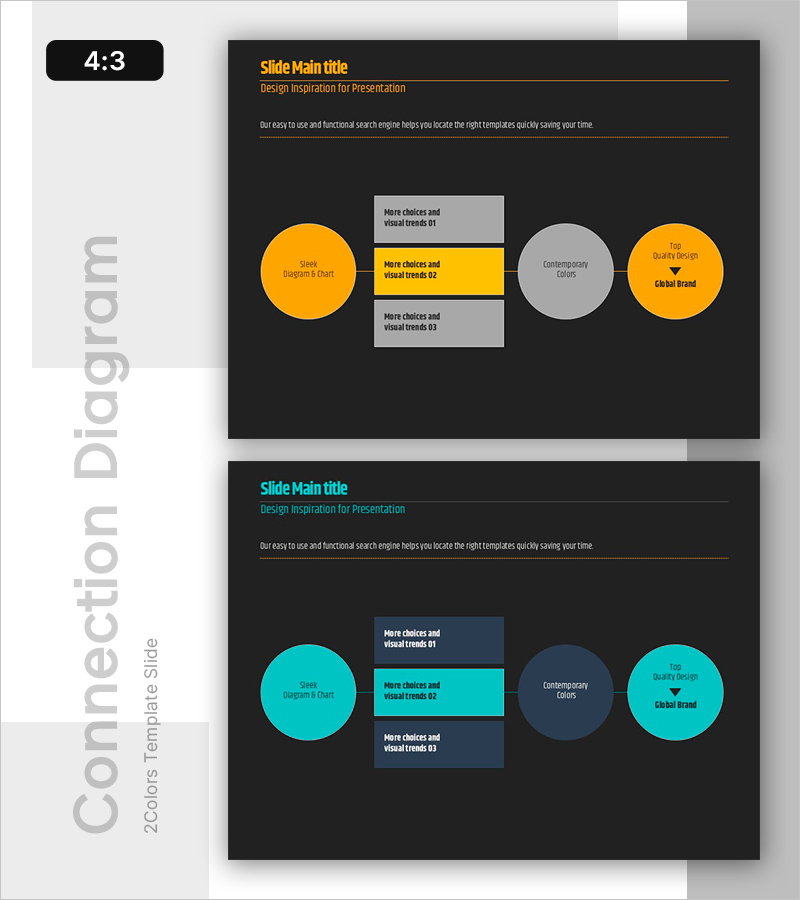
- Slide Ratio 4:3
- Color
Keywords
About the Product
A PowerPoint diagram slide that visualizes the structure and flow of six key elements through interconnected nodes and boxes. The design combines circular nodes with rectangular boxes to show how a central concept radiates outward to surrounding components. Orange and cyan dual-tone colors create strong visual contrast, while neutral gray elements clarify information hierarchy. This 2-slide PPT set is ready to use immediately for business strategy presentations, product composition explanations, organizational structures, and other professional contexts.
Usage Points
-
Main Usage
Explains how six key organizational elements relate to a central concept, or visually organizes product and service components. Ideal for strategy presentations, business model explanations, and process structuring where complex information needs hierarchical visualization.
-
How to Use
Enter your core concept (e.g., business strategy, product name) in the large central circular node, then place supporting elements in surrounding nodes and boxes. Text is fully editable for quick customization, and color changes are simple to implement.
-
Recommended For
Executive reports, business plans, product launch presentations, organizational structure explanations, and marketing strategy documents. Recommended for consulting, IT, finance, and manufacturing industries where complex information visualization is essential.
-
Slide Structure
2-slide set. First slide features orange-tone circular nodes (one large on left, two medium on right) with three central rectangular boxes representing six elements. Second slide repeats the identical structure in cyan tone, providing color variation options. 4:3 aspect ratio, PPTX format.
Related Products
-

Portfolio Profile Slide – Company Timeline and Cluster
#Company Introduction #Diagram #History
-

Leaves Donut Chart – Fresh Approach to Data Visualization
#Product/Service Introduction #Market and Competitor Analysis #Diagram
-

Visualizing Business Goals and Promotion Plans in a Cluster Slide – Vision and Growth
#Business Vision and Strategy #Business Management #Diagram
-

Global Target Country Analysis Presentation – Market and Competitor Analysis
#Company Introduction #Market and Competitor Analysis #Diagram
