Free Schedule Table Slides – Efficient Time Management Tool
RB0800013_17
- Last Update 03/20/2025
- File Size 7.5MB
- # of Slides 2
- File Format PPTX
- Slide Ratio 4:3
Keywords
About the Product
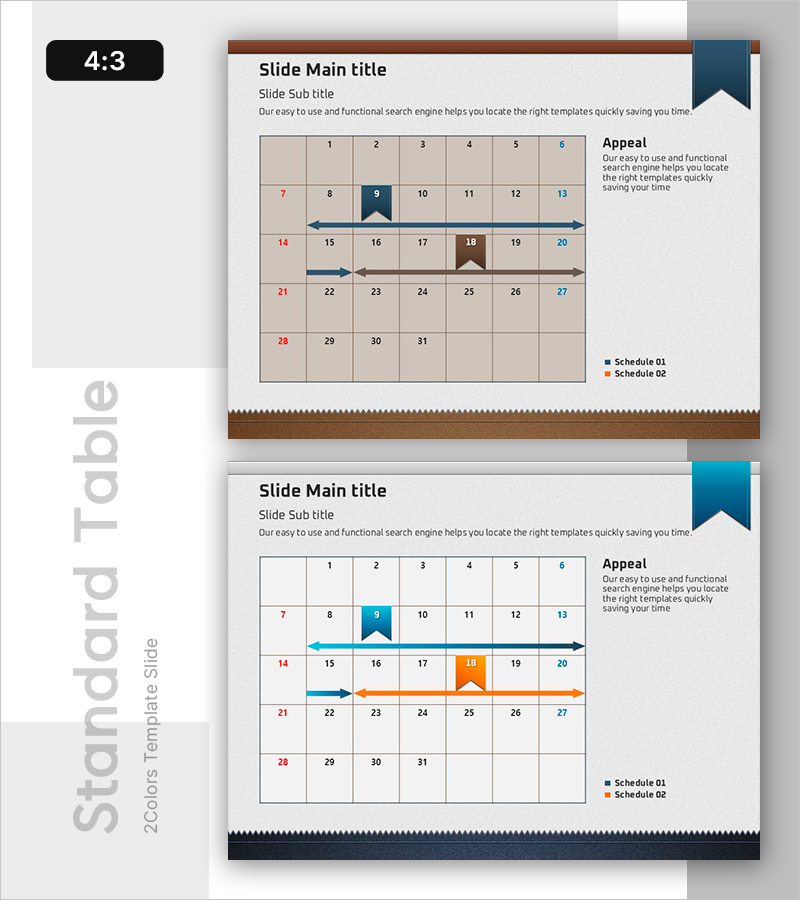
A table diagram PowerPoint slide for managing monthly schedules at a glance. The 6-column × 5-row grid structure organizes dates and tasks systematically, with a two-tone brown and blue background and accent colors (dark blue, brown, orange) highlighting key events. Horizontal arrow connectors visualize task relationships, while a legend (Schedule 01, 02) tracks multiple projects simultaneously. The 4:3 aspect ratio, 2-slide set is ready for presentations, reports, and planning documents. All text and colors are fully editable in PPTX format.
Usage Points
-
Main Usage
Visualize monthly project schedules, team task plans, milestone tracking, and resource allocation status for stakeholder communication. The table structure clearly separates date-based activities, while color highlights enable instant priority recognition.
-
How to Use
Enter dates and task names in each cell, then use color fill to highlight priority items. Drag arrow connectors to show task dependencies, and modify the legend to distinguish multiple projects. Use as presentation slides, planning documents, or status reports.
-
Recommended For
Project managers, team leads, planning and operations coordinators, marketing planners, and product development teams benefit from this slide for monthly planning, milestone sharing, and team meeting materials. Suitable for business plans, proposals, and progress reports.
-
Slide Structure
2-slide set. Slide 1: 6-column (1–6) × 5-row (7–31) grid table with brown-blue two-tone background, dark blue/brown/orange accent cells, and 2 horizontal arrow connectors. Slide 2: identical structure with blue two-tone background, orange and blue accent cells, and horizontal arrow connectors. Includes 'Appeal' text box and legend (Schedule 01, 02) on the right.
Related Products
-

Baby Products Business Service Overview PowerPoint Slide
#Product/Service Introduction #Diagram #Product/Service Introduction
-

Visualizing Market Share with Plus Donut Chart
#Market and Competitor Analysis #Diagram #Graph
-

Nature Protection Follow-Up Maintenance Plan Infographic
#Product/Service Introduction #Operational Plan #Diagram
-

Sequential Process Diagram Slide | Step-by-Step Flow PPT
#Business Strategy #Diagram #Implementation Framework
