Timeline of Core Technology Development – Vision and Strategy
RB0400005_6
- Last Update 03/11/2025
- File Size 1.8MB
- # of Slides 2
- File Format PPTX
- Slide Ratio 4:3
- Color
Keywords
- #Content-Based Slides
- #Design-Based Slides
- #Company Introduction
- #Business Vision and Strategy
- #Diagram
- #History
- #Business Goals
- #Cluster
- #Chain Diagram
- #4:3
- #timeline diagram PowerPoint slide
- #company history presentation template
- #3-stage flow chart PPT
- #vision strategy slide
- #technology development roadmap PowerPoint
About the Product
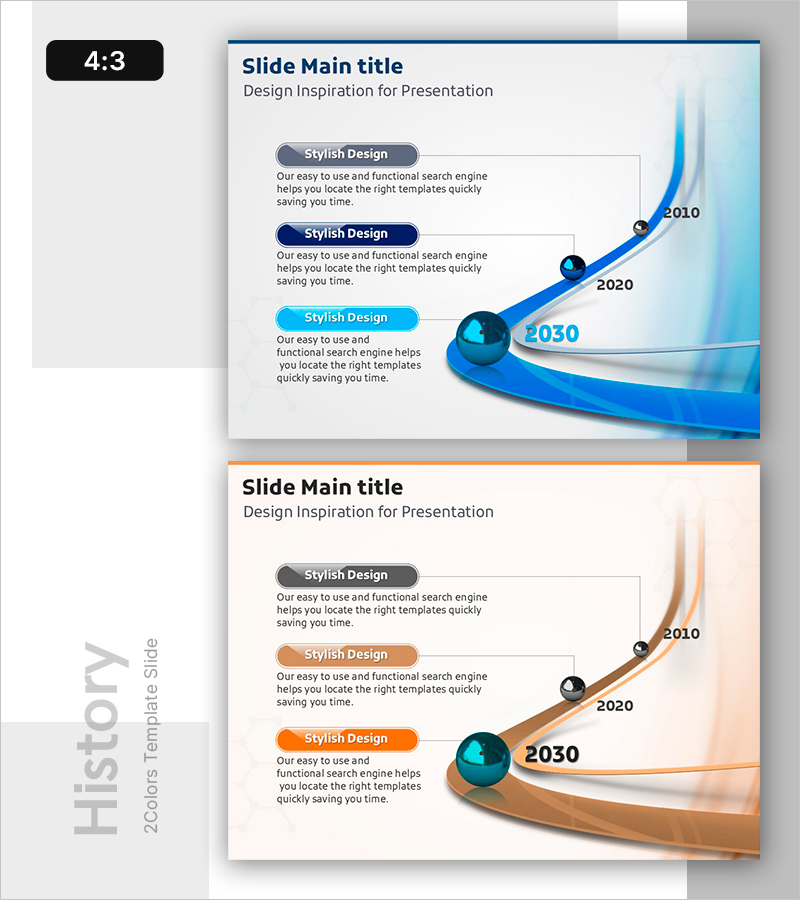
A professional 3-stage timeline diagram PowerPoint slide that visualizes your company's core technology development journey and future vision. Three spherical milestone nodes (2010, 2020, 2030) are connected by a flowing curved line, representing growth trajectory over time. The design features a light-to-dark blue gradient background with three text box areas positioned to highlight strategic milestones at each stage. This 4:3 ratio, 2-slide presentation template is ready to use in company profiles, business plans, and technology pitch decks.
Usage Points
-
Main Usage
Effectively communicate your organization's technology evolution and strategic vision across past achievements, present state, and future goals. The timeline format creates a compelling narrative arc that demonstrates continuous growth and forward momentum.
-
How to Use
Insert this slide into company overview presentations, business plan roadmap sections, and investor pitch decks. Customize each text box with specific years, key achievements, and strategic objectives to align with your presentation narrative.
-
Recommended For
Technology companies, manufacturing firms, IT startups, and innovation-focused organizations presenting to executives, investors, and new employees. Ideal for any business presentation requiring emphasis on organizational growth trajectory and strategic evolution.
-
Slide Structure
Three spherical nodes representing milestone years are connected by a smooth curved flow line. Three text boxes are positioned to the left of each node for content input. The background transitions from light gray to deep blue, visually reinforcing temporal progression.
Related Products
-

Traditional PPT Future Goals and Schedule Plan – Vision-Embedded Cluster
#Company Introduction #Business Vision and Strategy #Diagram
-

List of Studies by Year Slide – Business Strategy and Vision
#Company Introduction #Business Vision and Strategy #Diagram
-

Renewable Energy Company History Diagram
#Company Introduction #Business Vision and Strategy #Diagram
-

Timeline Diagram for Business Goals and Schedule – Journey to Achieve Vision
#Company Introduction #Business Vision and Strategy #Diagram
