Connection Diagram for Propulsion Goals – Vision for Achievement
RB0800010_15
- Last Update 03/19/2025
- File Size 1.4MB
- # of Slides 2
- File Format PPTX
- Slide Ratio 4:3
- Color
Keywords
About the Product
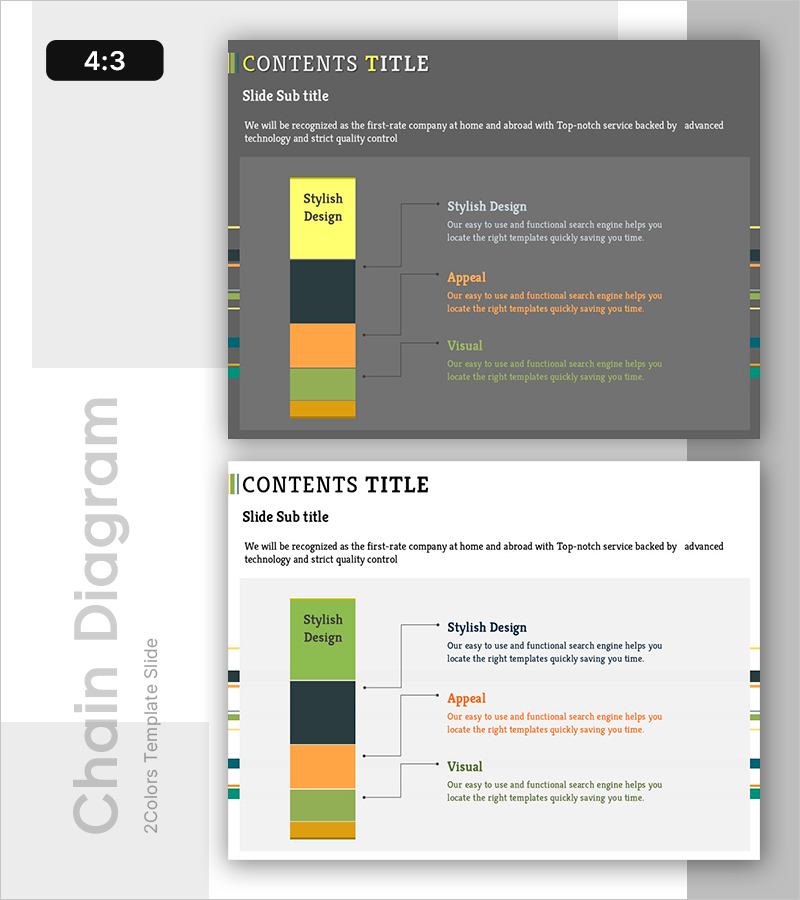
A 4-stage connection diagram PowerPoint slide that visualizes the flow of organizational goals and strategic initiatives. The design features four colored boxes (yellow, dark gray, orange, and gold) arranged vertically on a gray background, connected by directional arrows to show progression. Each stage includes a text area on the right side for detailed descriptions, making it ideal for presenting business objectives, strategic initiatives, and execution plans. This 4:3 ratio, 2-slide template is ready to use immediately for professional presentations.
Usage Points
-
Main Usage
Visualizes organizational goals, business strategies, and execution plans in sequential stages, showing the pathway to goal achievement. Clarifies the role and interdependencies of each stage, building organizational alignment and improving strategic understanding across teams.
-
How to Use
Use in executive reports, strategy presentations, and business plan meetings to explain goal hierarchies and strategic connections. Input goal names, strategic initiatives, execution tasks, and performance metrics into each box to represent your organization's goal linkage structure.
-
Recommended For
Executives, strategic planning teams, business development managers, and project managers explaining organizational goal connections and execution plans. Suitable for business plans, management reports, and strategic planning meeting materials.
-
Slide Structure
Four stage boxes (yellow, dark gray, orange, gold) arranged vertically and connected by directional arrows showing sequential flow. Each box includes a title and description text area on the right for detailed information input. The 2-slide format allows representation of multiple goal frameworks.
Related Products
-

Startup Investment Funding Plan Table – Blueprint Preparation
#Financial Plans and Performance #Diagram #Capital Requirements
-

3-Step Guide to Building a Healthy Meal Slide
#Product/Service Introduction #Business Vision and Strategy #Diagram
-

Industry-leading representatives & team personnel – Effective Organizational Chart
#Company Introduction #Diagram #Manpower
-

Connected Diagram – Stylish Diagram Slide
#Business Vision and Strategy #Operational Plan #Diagram
