Orange & Blue Structure Diagram
RB0800008-1_20
- Last Update 03/18/2025
- File Size 1.7MB
- # of Slides 2
- File Format PPTX
- Slide Ratio 4:3
- Color
Keywords
- #Content-Based Slides
- #Design-Based Slides
- #Technical Approach
- #Diagram
- #Service Architecture Diagram
- #Service Operation Plan
- #Structure
- #Cluster
- #Tree Diagram
- #Closed Cluster Diagram
- #4:3
- #closed structure diagram PowerPoint
- #3-level hierarchy slide
- #organizational structure template
- #service architecture diagram
- #hierarchical flowchart PPT
- #business structure slide design
About the Product
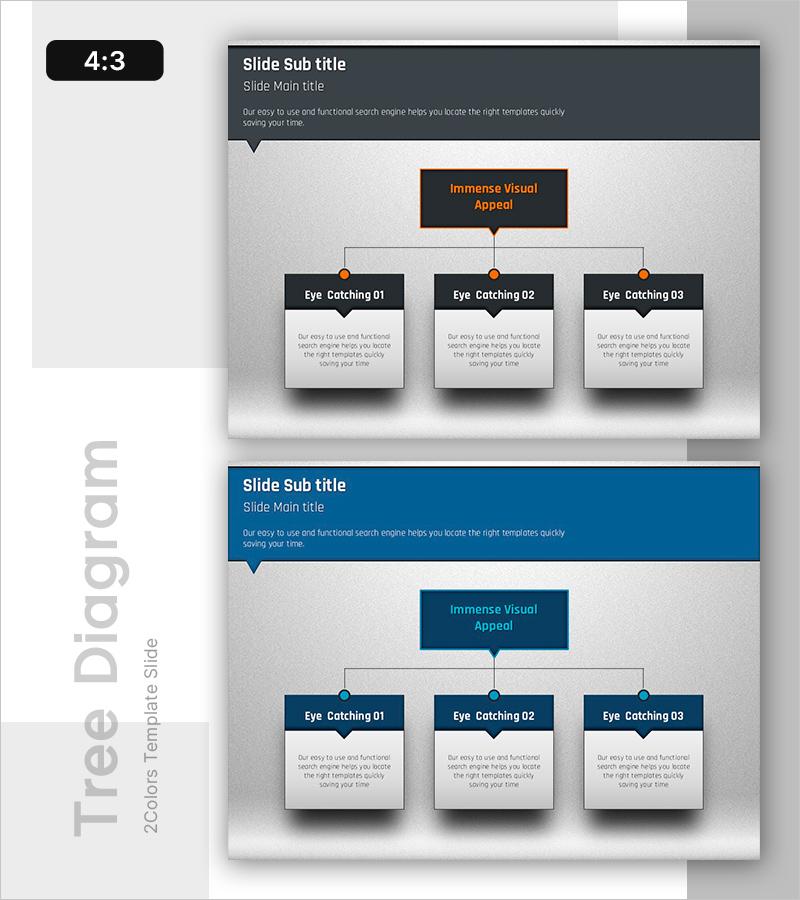
A closed-structure diagram PowerPoint slide that branches from a central concept to three subordinate items. The design uses orange accent color and dark blue background for strong visual contrast, with circular nodes and straight connector lines to clearly express hierarchical relationships. This 2-slide set (4:3 aspect ratio) is ready to use for explaining service architecture, organizational structure, operational frameworks, and other business hierarchies. Ample text editing areas allow flexible content customization.
Usage Points
-
Main Usage
Optimized for visualizing structures with clear hierarchical relationships such as organizational levels, service composition, and operational systems. The closed-structure format branches from a central concept to three subordinate items, making it ideal for explaining decision flows, departmental hierarchies, service operations, and various business structures intuitively.
-
How to Use
Use in company profile presentations for organizational structure sections, proposal documents for service architecture pages, business plans for operational framework explanations, and marketing presentations for channel structure diagrams. Double-click node text to edit with your content, and adjust node colors as needed to emphasize importance.
-
Recommended For
HR professionals explaining organizational structures, marketing and sales teams presenting service systems, strategy teams planning operational frameworks, and executives presenting departmental relationships. Particularly effective for structures with clear levels where hierarchical relationships are critical.
-
Slide Structure
2-slide set (4:3 ratio). Slide 1: Dark gray background with orange accent text box and 3-level closed structure diagram (1 central node → 3 subordinate nodes below, circular nodes with straight connectors). Slide 2: Dark blue background with identical structure. Each node includes text input area.
Related Products
-

Trial Tree Structure – Legal and Service Overview
#Technical Approach #Diagram #Service Architecture Diagram
-

System Execution Flow – Efficient Service Operations Strategy
#Technical Approach #Diagram #Service Architecture Diagram
-

Beer Tree Structure Chart – A New Paradigm of Data Visualization
#Product/Service Introduction #Technical Approach #Diagram
-

Tree Structure in Natural Background – System Diagram
#Technical Approach #Diagram #Service Architecture Diagram
