Red Orange Tree Structure – Effective Service Composition
RJ0600097_22
- Last Update 07/17/2025
- File Size 1.9MB
- # of Slides 2
- File Format PPTX
- Slide Ratio 16:9
- Color
Keywords
- #Content-Based Slides
- #Design-Based Slides
- #Technical Approach
- #Diagram
- #Service Architecture Diagram
- #Service Components
- #Structure
- #Cluster
- #Tree Diagram
- #Closed Cluster Diagram
- #16:9
- #tree diagram PowerPoint
- #hierarchical structure slide template
- #service composition diagram
- #organizational chart
- #4-level structure presentation
About the Product
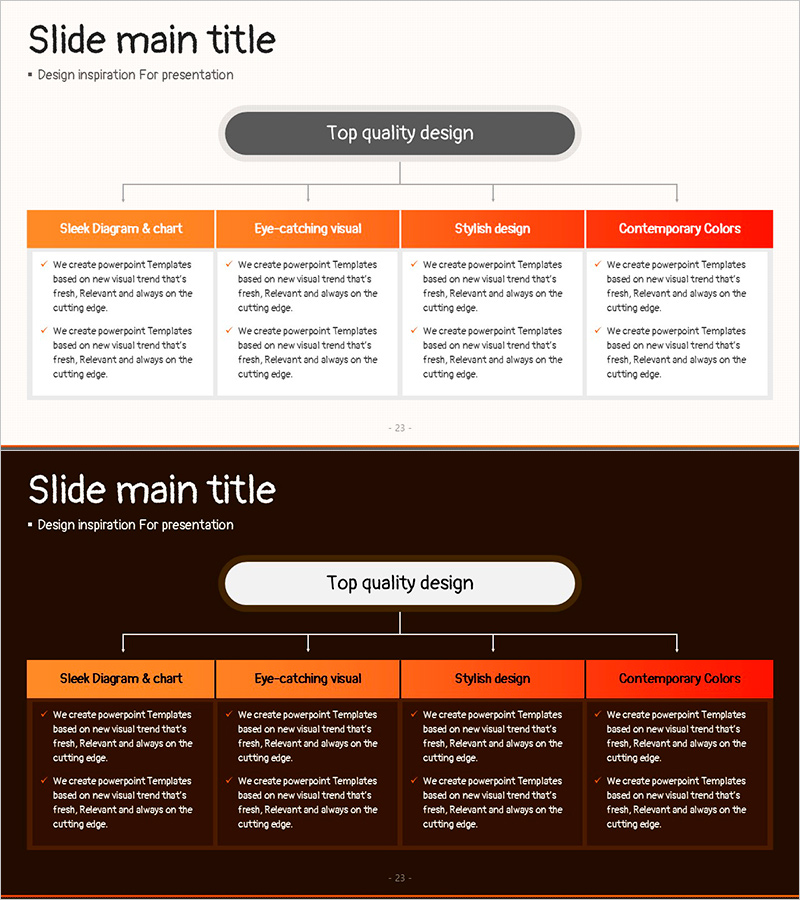
A tree diagram PowerPoint slide that visualizes a 4-level hierarchical structure. Starting from a red-orange box at the top, it branches into 4 subordinate items in a closed-form structure, effectively expressing service composition, organizational hierarchy, and technical architecture. Each node includes text input areas for immediate editing, with white background and orange accent colors to distinguish information levels. The 2-slide set is adaptable to various presentation scenarios.
Usage Points
-
Main Usage
Systematically expresses information that branches from upper-level concepts to lower-level items, such as organizational hierarchy, service composition, technical architecture, and process classification. The 4-level closed-form structure visualizes clear hierarchical relationships to enhance audience comprehension.
-
How to Use
Enter the core concept in the top center box and write detailed items in the 4 subordinate nodes. Suitable for technical presentations, service introductions, organizational structure explanations, and business classification scenarios to clearly convey information hierarchy.
-
Recommended For
Technical professionals, business planners, marketing managers, consultants, and educators explaining organizational structures, technology stacks, service portfolios, and business classifications.
-
Slide Structure
One red-orange box at the top center connected by vertical lines to 4 orange boxes below in a closed-form tree structure. Each node contains text input areas, with white background and orange accent colors expressing hierarchical relationships.
Related Products
-

Tree Structure in Natural Background – System Diagram
#Technical Approach #Diagram #Service Architecture Diagram
-

Trial Tree Structure – Legal and Service Overview
#Technical Approach #Diagram #Service Architecture Diagram
-

Camping Business Support Plan – Expressed in Orange Yellow Diagram
#Product/Service Introduction #Technical Approach #Diagram
-

Stripe Template Tree Structure – Capturing the Framework of Service Composition
#Technical Approach #Diagram #Service Components
