Keyword Diagram for Origami Design – Creative Visual Representation
RB0800007_12
- Last Update 03/18/2025
- File Size 0.2MB
- # of Slides 2
- File Format PPTX
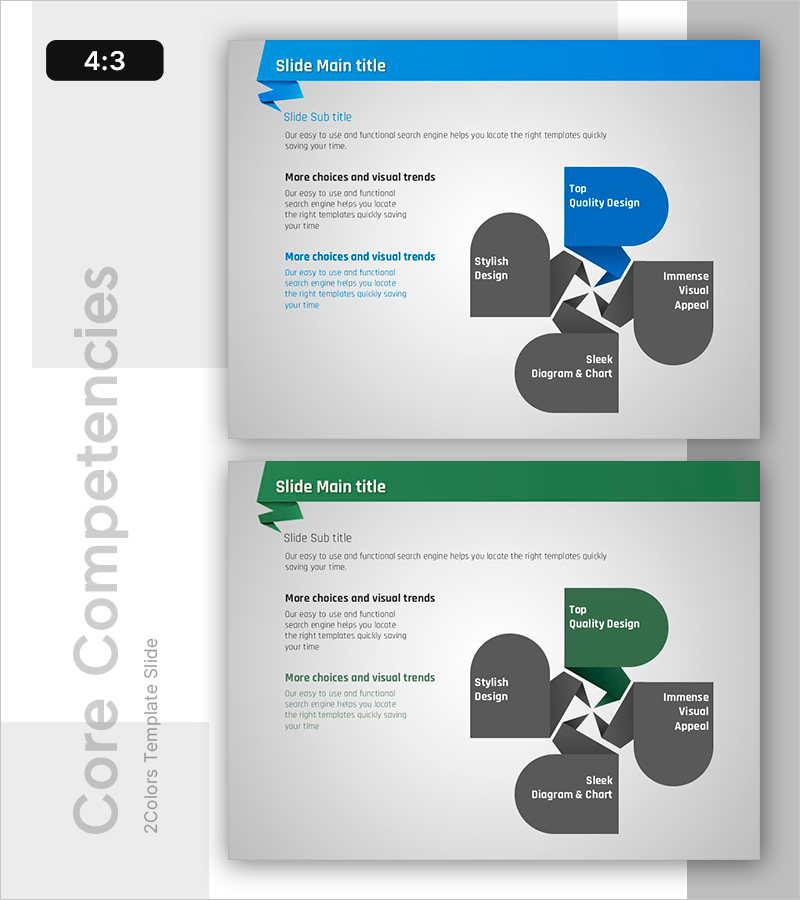
- Slide Ratio 4:3
- Color
Keywords
About the Product
A radial diagram PowerPoint slide featuring five topics radiating from a central concept. The design combines blue accent colors with dark gray nodes to create clear visual hierarchy. Each node provides an independent text area, with arrow connections emphasizing the relationship to the center. This 4:3 ratio, 2-slide presentation template is ready to use for concept explanation, strategy development, organizational structure, process analysis, and various business presentations.
Usage Points
-
Main Usage
Visualizes relationships where a central concept expands to multiple topics, strategies, or elements. Placing the core idea at the center and arranging related items radially clarifies information hierarchy. Applicable to business strategy, organizational structure, marketing channels, technology stack, and various other contexts.
-
How to Use
Enter the core concept in the center node and detailed items in the five surrounding nodes. Use the blue accent area to highlight the most important item, while dark gray nodes hold supporting information. You can explain each node sequentially during presentation or display the entire structure at once.
-
Recommended For
Executives, planners, marketers, and project managers use this for strategy development, organizational restructuring, new business introduction, and technology architecture explanation. Suitable for executive reports, team meetings, client presentations, and educational seminars.
-
Slide Structure
Two-slide layout. First slide features a blue header banner with a 5-node radial diagram (1 center + 5 surrounding nodes) and left text area. Second slide includes a green header banner with the same diagram structure for flexible content application. PPTX format in 4:3 ratio with fully editable nodes and text areas.
Related Products
-

Sales & Investment Plan Slide Template
#Operational Plan #Financial Plans and Performance #Diagram
-

How to Use Exercise Equipment – Effective Usage Guidelines
#Product/Service Introduction #Diagram #Text Box
-

Folder Shape Diffusion Diagram – Business Vision and Marketing Strategy
#Business Vision and Strategy #Marketing Plan and Strategy #Diagram
-

Cluster Diagram Slide Emphasizing Shooting Points
#Business Vision and Strategy #Diagram #Business Strategy
