Keyword Connection Diagram – Visualizing Business Vision and Strategy
RB0800003_12
- Last Update 03/17/2025
- File Size 0.1MB
- # of Slides 2
- File Format PPTX
- Slide Ratio 4:3
- Color
Keywords
- #Content-Based Slides
- #Design-Based Slides
- #Business Vision and Strategy
- #Diagram
- #Business Vision
- #Business Strategy
- #Cluster
- #Spread
- #Chain Diagram
- #Decentralized Diagram
- #4:3
- #connection diagram PowerPoint
- #cluster diagram slide
- #3-node diagram template
- #vision strategy PPT
- #relationship diagram PowerPoint
About the Product
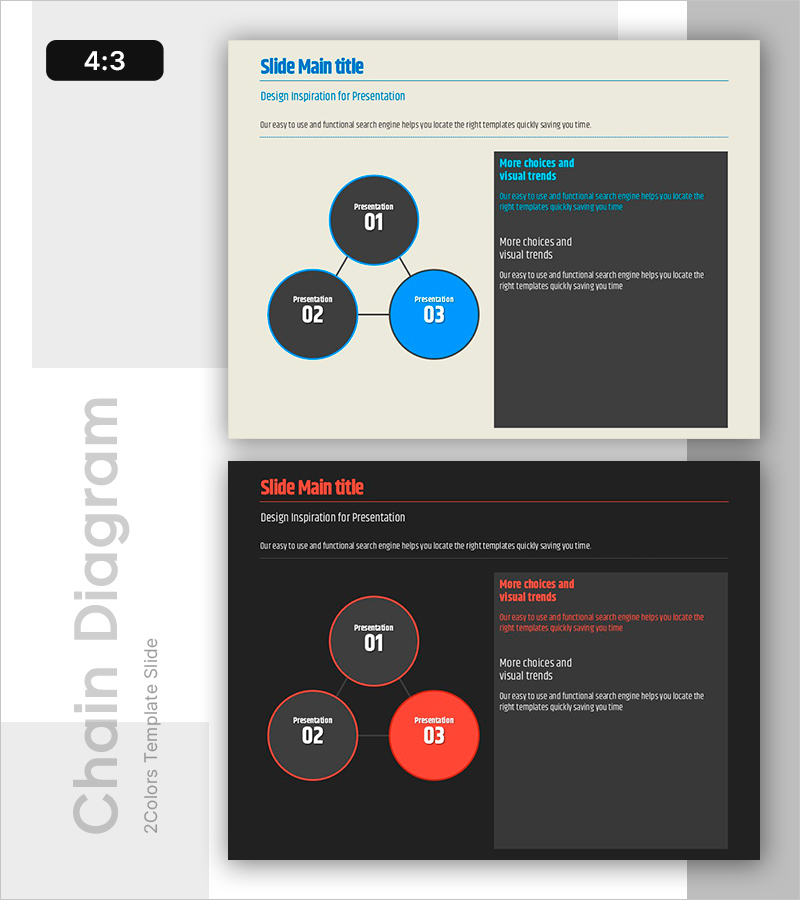
A cluster diagram PowerPoint slide featuring three circular nodes connected by lines. The design uses a two-tone color scheme with dark gray and bright blue to emphasize the central element, allowing you to input text and numbers in each node to visualize three key relationships such as business vision, strategy, and core values. Provided in 4:3 aspect ratio with 2 slides in both light and dark background versions, so you can choose the version that matches your presentation tone. This PowerPoint slide is ready to use immediately when you want to clearly express the connections between concepts in your presentation.
Usage Points
-
Main Usage
Visually express the relationships and connections between three key concepts such as business vision, strategy, and core values. By inputting text into each node, you can clearly communicate how the organization's key elements interact with one another.
-
How to Use
Double-click the text inside each circular node to edit with your own content. You can adjust node size, line thickness, and colors as needed. The light background version is suitable for printed materials, while the dark background version works best for screen presentations.
-
Recommended For
Ideal for executive reports, business plans, strategy presentations, organizational culture introductions, and company vision-sharing sessions. Also useful in marketing plans to express relationships between brand core elements.
-
Slide Structure
Three circular nodes arranged in a triangular layout and connected by lines. The center or right node is highlighted in an accent color (blue) to emphasize the primary element. Consists of 2 slides with light beige and dark black background versions.
Related Products
-

Folder Shape Diffusion Diagram – Business Vision and Marketing Strategy
#Business Vision and Strategy #Marketing Plan and Strategy #Diagram
-

Animal Illustration Slide for Effective Vision Strategy Communication
#Business Vision and Strategy #Diagram #Business Vision
-

Business Strategy Circular Diagram - Connect Vision and Goals
#Business Vision and Strategy #Diagram #Business Vision
-

Global Content Strategy and Keyword Flow – Business Vision and Strategy
#Business Vision and Strategy #Diagram #Business Vision
