Visualizing Marketing Plans and Strategies with a Cluster Diagram – Harmony of Creativity and Connection
RJ0600058_6
- Last Update 07/06/2025
- File Size 1.7MB
- # of Slides 2
- File Format PPTX
- Slide Ratio 16:9
- Color
Keywords
- #Content-Based Slides
- #Design-Based Slides
- #Business Vision and Strategy
- #Marketing Plan and Strategy
- #Diagram
- #Business Strategy
- #Marketing Strategy
- #Cluster
- #Spread
- #Chain Diagram
- #Decentralized Diagram
- #16:9
- #cluster diagram PowerPoint
- #overlapping diagram slide
- #marketing strategy presentation
- #3-node diagram template
- #relationship diagram PPT
- #business diagram PowerPoint slide
About the Product
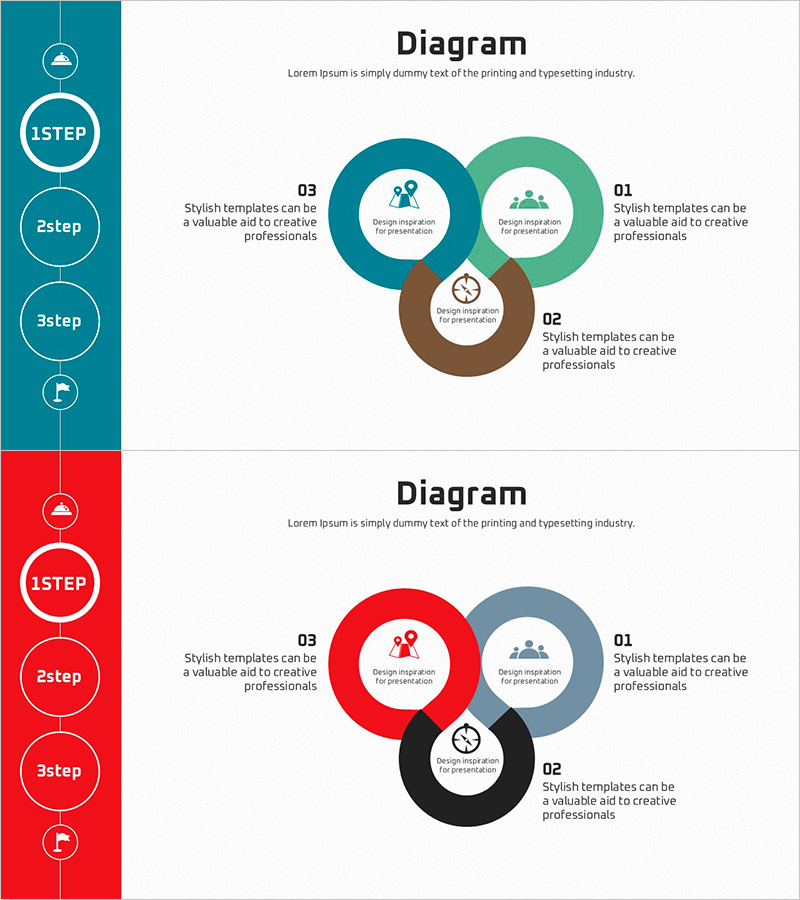
A 3-node overlapping cluster diagram PowerPoint slide designed to visualize marketing plans and business strategies. The left sidebar features a vertical step progression indicator (1STEP, 2step, 3step) with icons and connecting lines, while the center displays three circular nodes in teal, red, and brown that overlap to emphasize interconnection and integrated strategy. The intersection area at the center is ideal for highlighting core messages and shared objectives. This 2-slide presentation template is ready to edit and deploy immediately for various business contexts.
Usage Points
-
Main Usage
Visualize marketing plans, business strategies, and cross-functional relationships using three overlapping circular nodes to demonstrate interconnectedness and integrated approach. Assign departments, teams, or strategic elements to each node and emphasize core objectives in the central intersection area.
-
How to Use
Input text and icons into each of the three circular nodes alongside the left-side step progression indicator. Maintain the color scheme (teal, red, brown, black) or customize with your corporate brand colors to match your presentation style and organizational identity.
-
Recommended For
Ideal for marketing managers, strategy planning teams, and executive presentations. Effective for business plan pitches, strategic planning meetings, cross-departmental project introductions, and investor pitch decks where complex relationships and integrated strategies need clear visual representation.
-
Slide Structure
2-slide format with title area at top and left sidebar containing vertical progression indicator (4 icons, 3 circular nodes, connecting lines). Center-right area displays 3 overlapping circular nodes (approximately 120px diameter each) with icon and text input areas inside. 16:9 widescreen aspect ratio in PPTX format.
Related Products
-

Folder Shape Diffusion Diagram – Business Vision and Marketing Strategy
#Business Vision and Strategy #Marketing Plan and Strategy #Diagram
-

Business Connections Circular Diagram – Business Goals and Strategies
#Business Vision and Strategy #Diagram #Business Strategy
-

Winning League Strategy – Business Vision and Marketing Strategy
#Business Vision and Strategy #Marketing Plan and Strategy #Diagram
-

Space Business Strategy Connection Diagram – Vision of Innovation
#Business Vision and Strategy #Marketing Plan and Strategy #Diagram
