Blue Primary Table Slide – Emphasizing Financial Performance with Diagrams
RB0800001_13
- Last Update 03/17/2025
- File Size 0.5MB
- # of Slides 2
- File Format PPTX
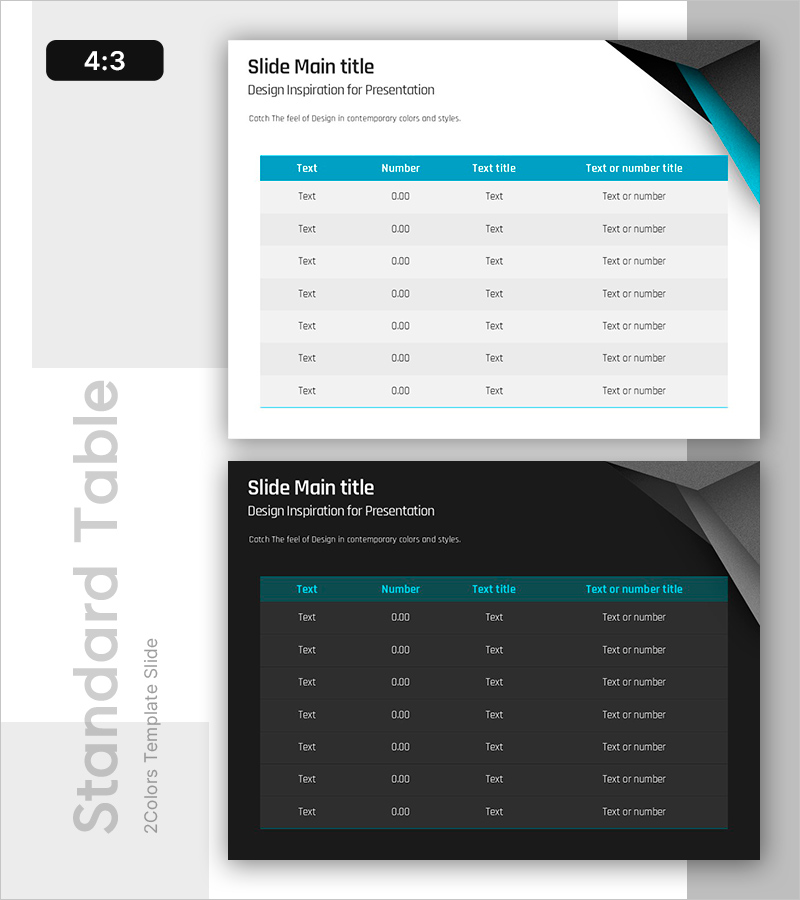
- Slide Ratio 4:3
- Color
Keywords
About the Product
A data table slide designed to clearly visualize financial performance and key metrics. The teal header and alternating white and gray rows maximize data readability. The 4-column structure accommodates text, numbers, titles, and descriptions simultaneously, making it immediately applicable to financial reports, investor presentations, and business plans. The 2-slide set provides both light and dark background versions to suit different presentation environments. Built with standard PowerPoint table functionality for easy data editing and customization.
Usage Points
-
Main Usage
Presents financial performance, key metrics, and budget status in clear tabular format. The teal header emphasizes the data area, while alternating row colors facilitate row-by-row information tracking and comparison across periods or categories.
-
How to Use
Use in investor relations presentations, financial reports, business plans, and quarterly performance reviews to display revenue, profit, cash flow, and key financial ratios. Enter item names in text cells, amounts in number cells, and categories in title cells for immediate use.
-
Recommended For
Recommended for CFOs, finance managers, investor relations professionals, and executives presenting financial status. Particularly valuable in banking, insurance, manufacturing, and distribution industries where data-driven decision-making is critical.
-
Slide Structure
4-column (text, number, title, description) × 7-row data table structure. Header row highlighted in teal, data rows alternating between white and light gray for enhanced readability. Includes both light and dark background versions for flexible presentation contexts.
Related Products
-

Learning Illustrations and Table Charts – Visualizing Financial Performance
#Financial Plans and Performance #Diagram #Income Statement
-

Red Purple Highlight Table – An Ideal Choice for Financial Planning
#Financial Plans and Performance #Diagram #Budget
-

New Semester Template Table – Visualizing Financial Planning and Performance
#Financial Plans and Performance #Diagram #Projected Return on Investment (ROI)
-

Environmental Protection Expected Return on Investment Table – Finance Planning and Performance
#Financial Plans and Performance #Diagram #Key Financial Indicators
