Analysis of Ingredient Preference – Data Visualization Slide
RB0700013-1_8
- Last Update 03/16/2025
- File Size 2.3MB
- # of Slides 2
- File Format PPTX
- Slide Ratio 4:3
- Color
Keywords
- #Content-Based Slides
- #Design-Based Slides
- #Product/Service Introduction
- #Diagram
- #Differentiation Strategy for Products/Services
- #Cluster
- #Closed Cluster Diagram
- #4:3
- #closed cluster diagram PowerPoint
- #circular node slide template
- #data visualization diagram
- #product analysis PPT
- #preference analysis slide
About the Product
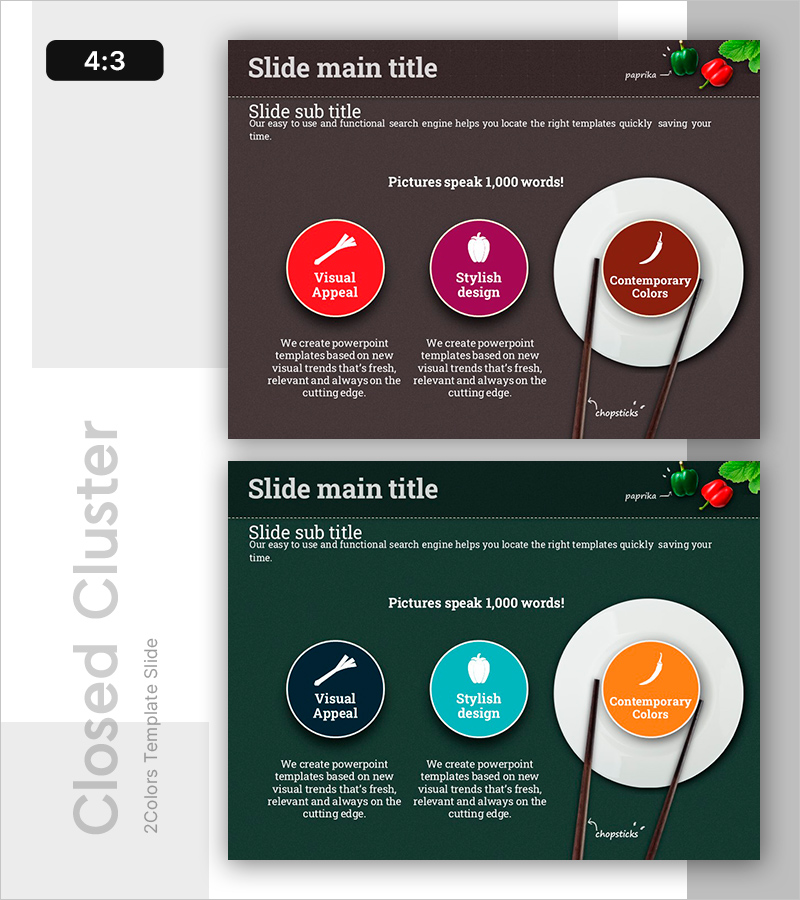
A closed cluster diagram PowerPoint slide designed to visualize ingredient preference analysis and product differentiation strategy. The design features one large circular node in the center and two smaller circular nodes on the left, expressing hierarchical relationships on a dark brown background with red, magenta, and brown circular elements. Each node contains editable icon and text areas, allowing you to clearly distinguish core categories from detailed items. Composed of 2 slides in 4:3 aspect ratio, this presentation template is ready to use in data-driven reports and marketing strategy documents.
Usage Points
-
Main Usage
Optimized for expressing ingredient, product, or customer preference analysis results in hierarchical relationships. Place your core topic in the central node and detailed categories in the left nodes to display multi-layer data structure at a glance.
-
How to Use
Double-click the icon and text areas inside each circular node to replace with your own data. Colors can be differentiated by category or unified, and node sizes and positions are adjustable based on data importance.
-
Recommended For
Ideal for marketing team consumer preference analysis presentations, product development team competitive analysis, and sales team customer segmentation strategy sessions. Effective for analysis sections in business plans, marketing proposals, and product introduction documents.
-
Slide Structure
Composed of 2 slides with a closed cluster structure: one large circular node in the center and two smaller circular nodes on the left of each slide. Dark brown and dark green background options are provided, with each node independently editable for color, size, and text.
Related Products
-

Adventure Business Support Plan Diagram – Innovative Approach
#Product/Service Introduction #Business Management #Diagram
-

Visualizing Efficient Execution Strategy – Differentiated Approach
#Product/Service Introduction #Business Vision and Strategy #Diagram
-

Big Data Business Differentiation Strategy - Innovation through Data
#Product/Service Introduction #Business Vision and Strategy #Diagram
-

Four Closed Diagrams of Travel Guide Business Differentiation Strategies
#Product/Service Introduction #Business Vision and Strategy #Diagram
