Chemical Reaction Mechanism Diagram – Intuitive Visualization through Service Structure
RB0400019_6
- Last Update 03/12/2025
- File Size 0.3MB
- # of Slides 2
- File Format PPTX
- Slide Ratio 4:3
- Color
Keywords
- #Content-Based Slides
- #Design-Based Slides
- #Technical Approach
- #Diagram
- #Service Architecture Diagram
- #Research and Development
- #Cluster
- #Spread
- #Chain Diagram
- #Centralized Diagram
- #4:3
- #radial diagram PowerPoint
- #central structure slide
- #service architecture diagram
- #8-node connection template
- #technology system visualization PPT
About the Product
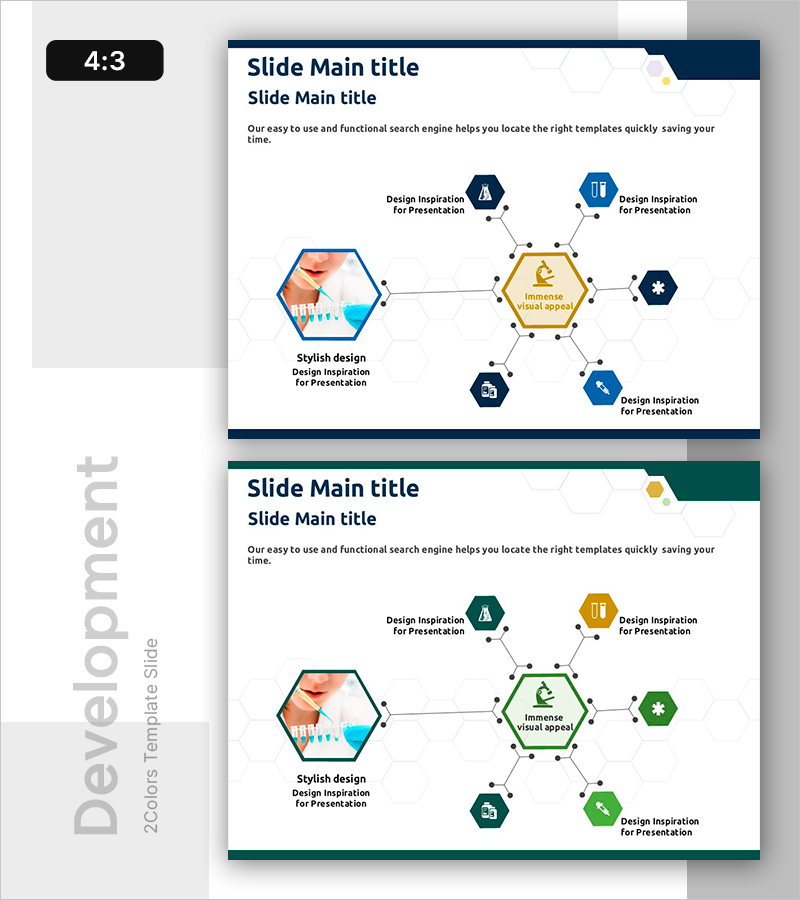
A PowerPoint slide featuring a radial diagram with a central yellow hexagon connected to 8 surrounding dark blue hexagon nodes, representing core elements and their relationships. This design effectively visualizes service structures, process relationships, technology systems, and organizational frameworks. The 2-slide set (4:3 aspect ratio) includes editable icons and text fields for immediate customization. Ideal for R&D presentations, technology briefings, strategic planning sessions, and technical architecture explanations.
Usage Points
-
Main Usage
Effectively communicate the relationships between a core concept and multiple supporting elements. Used to illustrate service ecosystems, technology architectures, strategic frameworks, research methodologies, and organizational structures in executive presentations and technical briefings.
-
How to Use
Enter your core concept in the central yellow hexagon and populate the 8 surrounding nodes with related items. Customize node icons by replacing them with relevant symbols, adjust colors to match your brand, and modify connecting lines to emphasize relationship strength or flow direction. All elements are fully editable.
-
Recommended For
R&D teams presenting technical innovations, product managers explaining service ecosystems, executives visualizing strategic frameworks, academic researchers illustrating research models, IT departments describing system architectures, and consultants mapping organizational structures.
-
Slide Structure
2-slide set in 4:3 format. Slide 1: Dark blue header with central yellow hexagon (core element) surrounded by 8 dark blue hexagons arranged radially (top, top-right, right, bottom-right, bottom, bottom-left, left, top-left) with connecting lines, editable icons, and text fields. Slide 2: Identical layout with green color variation. PPTX format.
Related Products
-

Structured Connectivity in a Diamond Shape - Presenting Tech Directions through Service Design
#Technical Approach #Diagram #Service Architecture Diagram
-

Service Structure and Benefits Explanation – Communicating Business Value
#Technical Approach #Diagram #Service Architecture Diagram
-

Trend and Status Analysis Slide – Blue Orange Diagram
#Business Management #Technical Approach #Diagram
-

Core Service Structure Diagram – Exploring Business Areas
#Business Introduction #Technical Approach #Diagram
