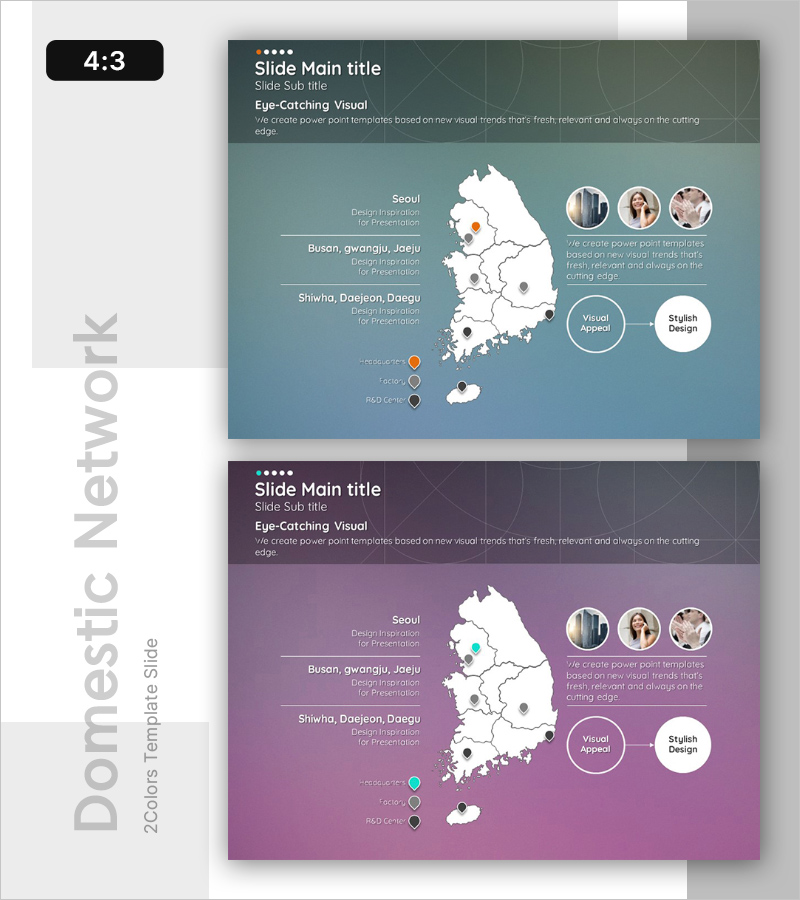
Regional Research Diagram – Visual Tool for Market Analysis
RB0200016_4
- Last Update 03/08/2025
- File Size 4.7MB
- # of Slides 2
- File Format PPTX
- Slide Ratio 4:3
- Color
Keywords
- #Content-Based Slides
- #Design-Based Slides
- #Company Introduction
- #Market and Competitor Analysis
- #Other
- #Domestic Network
- #Target Market
- #Map
- #4:3
- #Korea regional network map PowerPoint
- #Korean map PowerPoint slide
- #market analysis map diagram
- #regional hub visualization PPT
- #network structure diagram slide
About the Product
A PowerPoint slide visualizing regional hubs, personnel, and facilities across Korea using a detailed map. Available in two color options—teal and purple backgrounds—with left-side text areas for region names and descriptions, a central Korean peninsula map with circular icons, and upper-right section featuring three profile photos connected by lines. Ideal for market analysis, regional hub presentations, and organizational network visualization. Fully editable PPTX format with 2 slides.
Usage Points
-
Main Usage
Visualize regional branches, partner locations, and organizational networks across Korea using an integrated map design to communicate market expansion, business coverage, and hierarchical structure clearly to stakeholders.
-
How to Use
Enter region names and descriptions in left text areas, mark hub locations with circular icons on the map, and add personnel information in upper-right photo section to establish clear regional responsibility chains.
-
Recommended For
Recommended for market analysis sections, business area introductions, organizational structure explanations, and regional network presentations targeting executives, marketing teams, and sales departments.
-
Slide Structure
2-slide set with teal and purple background options. Each slide features three left-side text areas (region names/descriptions), central Korean peninsula map, three circular location icons, upper-right section with three profile photos and connecting lines.
Related Products
-

Domestic Network and Target Europe Map – Strategic Expansion
#Company Introduction #Market and Competitor Analysis #Other
-

USA Domestic Network Map – Market and Competitor Analysis
#Company Introduction #Market and Competitor Analysis #Other
-

Traffic Accident Ratio Infographic by Region – Data Visualization
#Company Introduction #Market and Competitor Analysis #Other
-

Domestic Network Europe Map Slide – Effective Market Analysis
#Company Introduction #Market and Competitor Analysis #Other
