USA Domestic Network Map – Market and Competitor Analysis
RJ0400014_19
- Last Update 05/21/2025
- File Size 0.9MB
- # of Slides 2
- File Format PPTX
- Slide Ratio 16:9
- Color
Keywords
About the Product
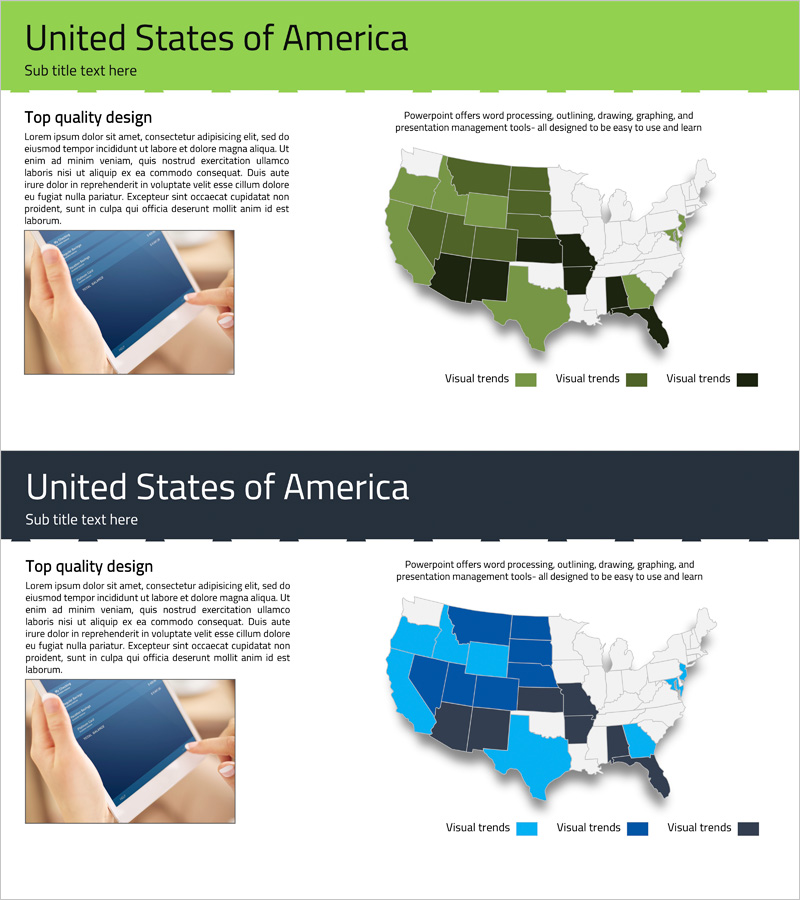
A map-based PowerPoint slide designed for analyzing the US domestic market and competitive landscape by state. Features lime green, dark blue, and black color coding to visualize market conditions, competitive intensity, and business penetration across all 50 states at a glance. The left side provides text space for analytical insights, while the right side displays a detailed USA map with color-coded states for regional data visualization. Includes two slide variations: a lime background version for bright presentation environments and a dark background version for modern, high-contrast settings. Both slides are fully editable in 16:9 widescreen format, allowing immediate customization of text, colors, and state assignments to match your specific market data and corporate branding.
Usage Points
-
Main Usage
Ideal for presenting US market entry strategies, competitive distribution analysis, and regional business performance reports. The color-coded state visualization transforms complex geographic data into intuitive insights, enabling clear communication of market positioning to investors, executives, and business partners.
-
How to Use
Enter market analysis content, competitive intensity assessments, and regional strategy details in the left text area. Color-code each state on the right map using the three provided colors (lime, dark blue, black) to represent market segmentation, competition levels, or business stage. Customize the legend at the bottom to match your analytical framework.
-
Recommended For
Perfect for marketing strategy presentations, business development reports, investor pitch decks, and executive briefings. Especially valuable for companies planning US market expansion, consulting firms conducting regional competitive analysis, and multinational corporations presenting market landscape assessments.
-
Slide Structure
Two-slide set featuring a bright lime background version and a dark background version for flexible presentation contexts. Each slide uses a two-column layout: left side (40%) for text input and analysis, right side (60%) for the USA map visualization with color-coded states. A three-color legend at the bottom explains the state categorization system.
Related Products
-

Key Regional Hubs Visualization – Showcasing Enhanced Connectivity
#Company Introduction #Market and Competitor Analysis #Diagram
-

South Korea Target Area Infrastructure Map – Market and Competitor Analysis
#Company Introduction #Market and Competitor Analysis #Other
-

Domestic Network and Target Europe Map – Strategic Expansion
#Company Introduction #Market and Competitor Analysis #Other
-

Korean Regional Analysis Slide – Market and Competitor Insights
#Company Introduction #Market and Competitor Analysis #Other
