Target Market Analysis Map – Essential Resource for Market and Competitor Analysis
RJ0300009_8
- Last Update 04/20/2025
- File Size 0.4MB
- # of Slides 2
- File Format PPTX
- Slide Ratio 16:9
- Color
Keywords
- #Content-Based Slides
- #Design-Based Slides
- #Company Introduction
- #Market and Competitor Analysis
- #Other
- #Domestic Network
- #Target Market
- #Map
- #16:9
- #USA map PowerPoint slide
- #market analysis map template
- #competitor analysis geographic visualization
- #business location map presentation
- #regional market analysis slide
About the Product
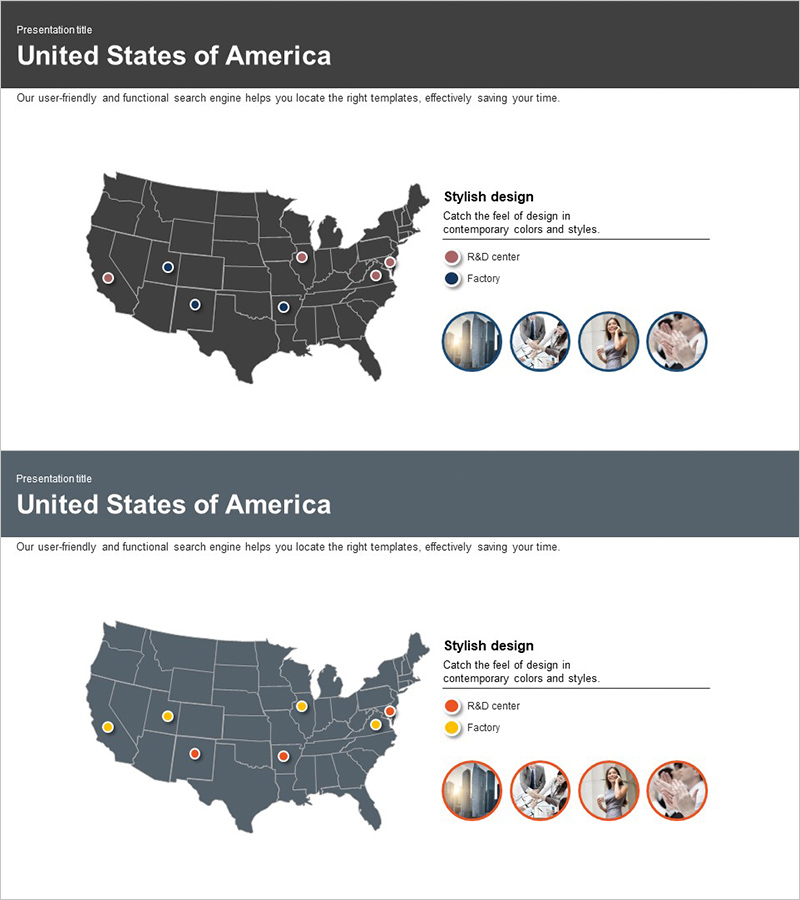
A 2-slide PowerPoint presentation featuring a geographic visualization of the United States with location markers for R&D centers and factories. The dark gray map background uses circular markers in blue and orange to pinpoint business locations, enabling clear communication of market analysis, competitor positioning, and operational footprint. Available in 16:9 widescreen PPTX format for immediate editing. Ideal for market analysis presentations, competitive landscape assessments, and investor briefings where regional business presence and market opportunities need to be highlighted. Includes text input areas and legend configuration for flexible data integration.
Usage Points
-
Main Usage
Visualize geographic distribution across the United States to communicate target market analysis, competitor locations, and business operations at a glance. Present regional market opportunities and competitive landscape as decision-making evidence.
-
How to Use
Place circular markers on the map to indicate R&D centers, factories, and branch offices. Use the legend to differentiate facility types. Add regional market size, market share, and competitor data in text areas to create comprehensive market analysis documentation.
-
Recommended For
Marketing and strategy teams presenting market analysis, investor presentations showcasing operational footprint, executive briefings on regional business strategy, and global companies explaining US market entry plans.
-
Slide Structure
Two-slide layout with the first slide featuring a dark gray USA map with blue and orange circular markers indicating R&D centers and factories, plus legend and text input areas. The second slide offers color variation (orange and yellow emphasis) to represent different analytical perspectives or facility categories.
Related Products
-

Traffic Accident Ratio Infographic by Region – Data Visualization
#Company Introduction #Market and Competitor Analysis #Other
-

Regional Research Diagram – Visual Tool for Market Analysis
#Company Introduction #Market and Competitor Analysis #Other
-

Key Regional Hubs Visualization – Showcasing Enhanced Connectivity
#Company Introduction #Market and Competitor Analysis #Diagram
-

Domestic Network and Target Europe Map – Strategic Expansion
#Company Introduction #Market and Competitor Analysis #Other
