Operating Program System for Risk Management – Multidirectional Flow Diagram
RB0100047_4
- Last Update 03/06/2025
- File Size 0.6MB
- # of Slides 2
- File Format PPTX
- Slide Ratio 4:3
- Color
Keywords
- #Content-Based Slides
- #Design-Based Slides
- #Product/Service Introduction
- #Operational Plan
- #Diagram
- #Program Introduction
- #Risk Management
- #Flow
- #Cluster
- #Multidirectional Flow
- #Closed Cluster Diagram
- #4:3
- #closed-loop diagram PowerPoint
- #3-node circular slide
- #cyclical relationship diagram
- #interconnected process slide
- #how to create a 3-node diagram in PowerPoint
About the Product
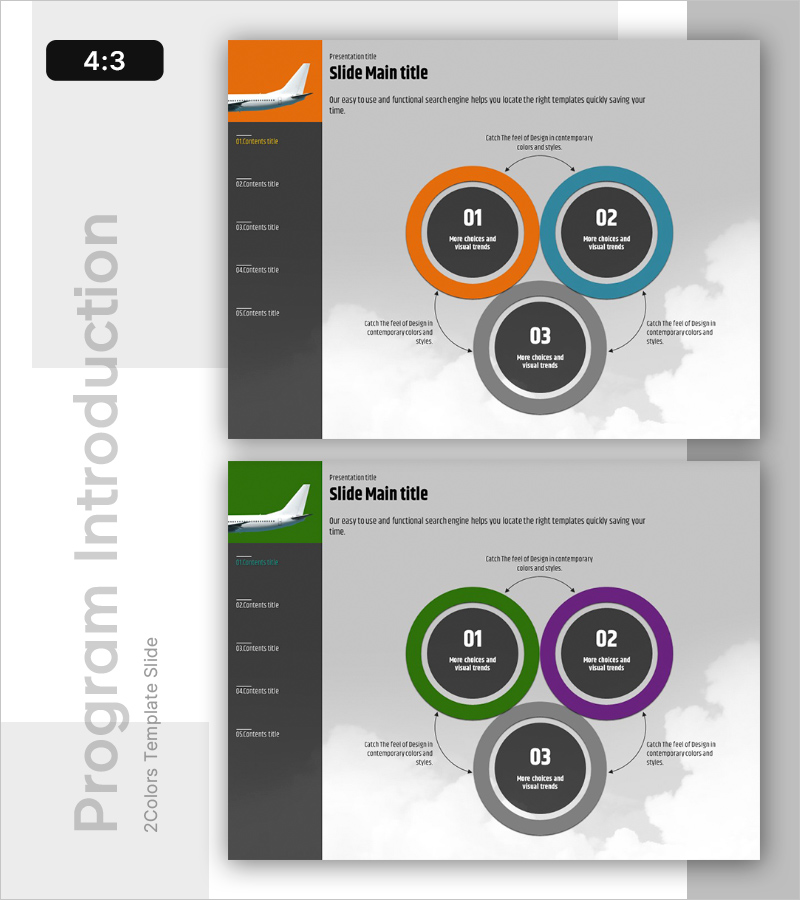
A closed-loop diagram PowerPoint slide featuring three interconnected circular nodes in contrasting colors: orange, teal, and gray. Each node is clearly distinguished by its color and connected via bidirectional arrows to express cyclical relationships and mutual interactions. The 4:3 aspect ratio template includes 2 slides with color variations, allowing you to select the version that best fits your presentation context. Text input areas are clearly marked for easy editing, making it ready for immediate use in visualizing processes, relationships, and interdependencies.
Usage Points
-
Main Usage
Visualizes mutual interactions, cyclical relationships, and closed-loop processes among three elements. Ideal for expressing operational systems, risk management frameworks, program structures, and inter-departmental collaboration. Each node accommodates a title and description, allowing customization to match your specific context.
-
How to Use
Enter phase names, element titles, or role descriptions in each circular node. Position the central node as a core concept with surrounding nodes as detailed items, or represent three equal-weight components. Use arrow directions to emphasize process flow or mutual influence between elements.
-
Recommended For
Executives, planning teams, operations managers, and project leaders presenting organizational structures, business processes, risk management systems, or strategic execution phases. Suitable for business plans, operational reports, organizational restructuring proposals, and quality management system presentations.
-
Slide Structure
Three identically-sized circular nodes (approximately 80px diameter) arranged in a triangular layout with interconnecting lines. Each node features an outer colored border (orange, teal, or gray) and an inner dark-gray circle with a centered number (01, 02, 03) and text input area. Bidirectional black arrows with arrowheads connect the nodes, with descriptive text areas positioned adjacent to each arrow. Both slides maintain identical structure with color variations only.
Related Products
-

Strategic Goal Comparison Layout Diagram – Cluster Visualization for Achieving Vision
#Product/Service Introduction #Business Vision and Strategy #Diagram
-

Slide Showing Pros and Cons – Diagram for Risk Management
#Operational Plan #Risk Management and Regulatory Compliance #Diagram
-

Shooting Training Diagram – Effective Operational Planning
#Operational Plan #Technical Approach #Diagram
-

Moisture Duration Diagram Slide for Product/Service Introduction
#Product/Service Introduction #Operational Plan #Diagram
