Pie Chart Analysis for International Trade – Market Share Visualization
RB0100042_8
- Last Update 03/05/2025
- File Size 8.4MB
- # of Slides 2
- File Format PPTX
- Slide Ratio 4:3
- Color
Keywords
About the Product
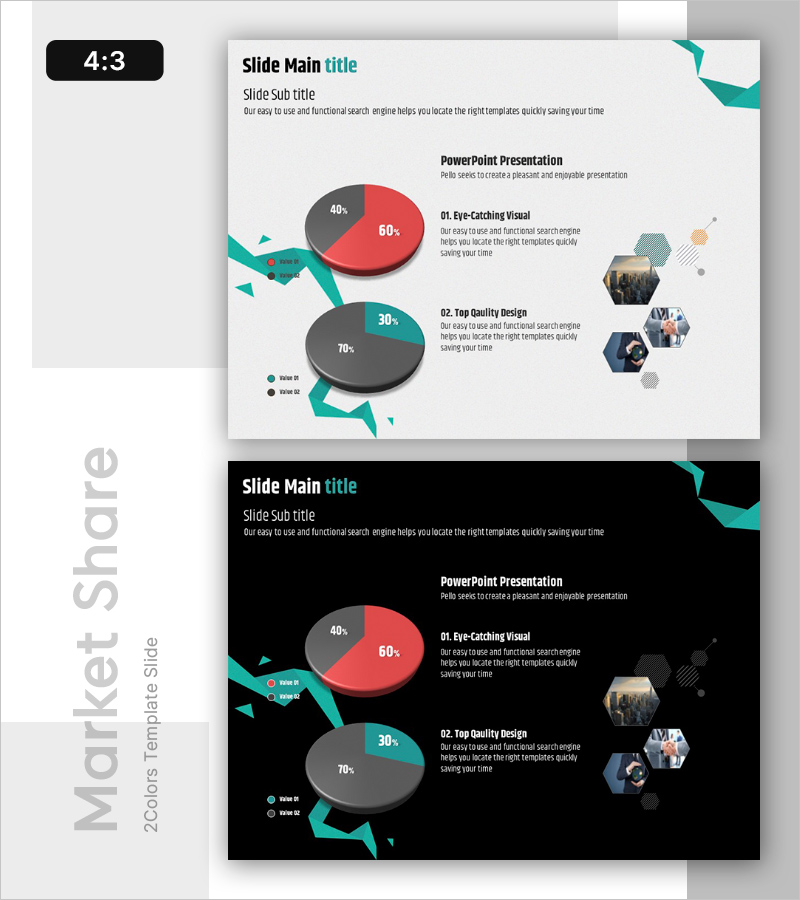
A professional PowerPoint slide template designed for international trade and market analysis presentations. Features two pie charts with teal and gray color schemes, displaying data ratios of 40%-60% and 30%-70% respectively. The left side includes a teal arrow flow diagram, while the right side incorporates three hexagonal image placeholders for visual context. This 4:3 aspect ratio, 2-slide template is fully editable and ready for immediate use in market share comparisons, competitive analysis, sales composition breakdowns, and strategic business presentations.
Usage Points
-
Main Usage
Visualize ratio-based data such as international trade metrics, market distribution, and sales performance using two pie charts simultaneously. The segmented circles clearly display comparative percentages while the left arrow diagram emphasizes data flow relationships and causal connections for audience comprehension.
-
How to Use
Slide 1 presents primary market share data through dual pie charts with legend indicators. Slide 2 provides detailed analysis text paired with the three hexagonal image areas on the right, allowing you to insert product photos, regional maps, or customer segment visuals for enhanced visual impact and storytelling.
-
Recommended For
Marketing professionals, executives, and sales teams presenting market conditions, competitive landscapes, and revenue distribution. Ideal for quarterly performance reports, investor presentations, strategic planning meetings, and business reviews in finance, international trade, consumer goods, and technology sectors.
-
Slide Structure
Slide 1: Title area + 2 pie charts (2-3 segments each) + legend + left teal arrow diagram. Slide 2: Title + descriptive text + 3 hexagonal image placeholders on right. 4:3 ratio with teal, gray, and red color palette.
Related Products
-

Pie Chart Composition Ratio Analysis – Market Status and Competitive Insights
#Market and Competitor Analysis #Graph #Market Status
-

Yellow Marketing Pie Chart – Market Share Analysis
#Market and Competitor Analysis #Graph #Market Status
-

Breakdown of Industry Market Share – Insights through Data Visualization
#Market and Competitor Analysis #Graph #Market Status
-

Agricultural Equipment Investment Plan Pie Chart
#Market and Competitor Analysis #Graph #Market Status
