Market Share Analysis through Art History – Designs with Competitive Advantage
RM0900015_6
- Last Update 03/05/2025
- File Size 31.8MB
- # of Slides 2
- File Format PPTX
- Slide Ratio 16:9
- Color
Keywords
- #Content-Based Slides
- #Design-Based Slides
- #Market and Competitor Analysis
- #Graph
- #Market Status
- #Competitive Advantage
- #Circles
- #16:9
- #market share analysis PowerPoint slide
- #circular chart presentation design
- #competitive analysis slide
- #how to visualize market share in PowerPoint
- #classical art business template
About the Product
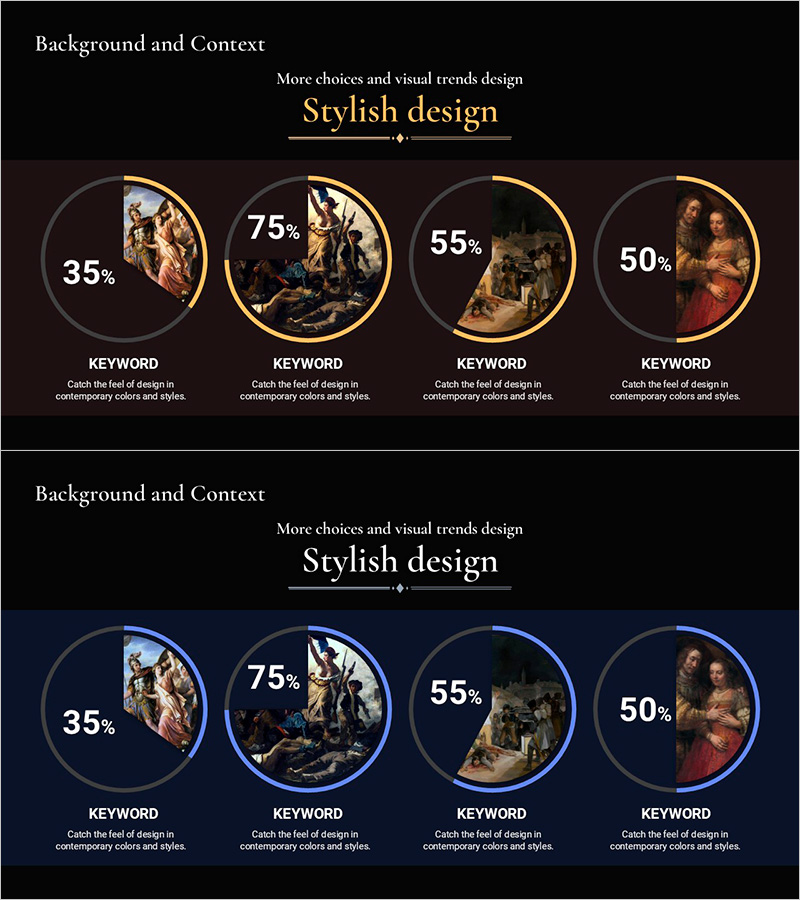
A market share analysis PowerPoint slide featuring classical art masterpieces in a premium design layout. The slide displays four circular pie charts (35%, 75%, 55%, 50%) against a dark brown and gold-tone background, with historical artwork images framed within each circular chart. This creates a sophisticated visual comparison of competitive market positions. Ideal for executive presentations, investor pitches, and competitive analysis reports. Includes two slide variations with gold and blue color schemes, fully editable in PPTX format for immediate customization.
Usage Points
-
Main Usage
Visualize competitive market positions using four circular pie charts, while leveraging classical art imagery to convey premium brand positioning. Effectively communicate market share data to executives, investors, and stakeholders in a memorable, visually distinctive format.
-
How to Use
Replace the percentage values with your actual market share data and substitute the classical artwork with company logos or product images. Choose between gold or blue color schemes based on your presentation context. Add descriptive text in the KEYWORD section below each chart to identify competitors or market segments.
-
Recommended For
Business executives, marketing managers, business development professionals, and investor relations teams presenting competitive analysis to C-suite, investors, and partners. Particularly effective for luxury brands, financial services, consulting firms, and premium product companies seeking to establish market leadership narratives.
-
Slide Structure
Two-slide set, each featuring a title area (Stylish design) and four circular chart sections. Each circular chart contains three editable elements: percentage display, classical artwork frame, and KEYWORD text field. Layout supports simultaneous comparison of up to four competitors or market segments with balanced visual hierarchy.
Related Products
-

SUV Percentage Donut Graph – Market Status Analysis
#Market and Competitor Analysis #Diagram #Graph
-

Doughnut Chart Slide for Market and Competitive Analysis – Sports Trends & Strategic Issues
#Market and Competitor Analysis #Diagram #Graph
-

Comparative Competition Donut Chart – Market and Competitor Analysis
#Market and Competitor Analysis #Graph #Market Status
-

Donut Chart of Credit Card Spending Categories – Market Insights
#Market and Competitor Analysis #Graph #Market Status
