Square History Diagram – Company History at a Glance
RJ0300071_5
- Last Update 05/08/2025
- File Size 0.2MB
- # of Slides 2
- File Format PPTX
- Slide Ratio 16:9
- Color
Keywords
- #Content-Based Slides
- #Design-Based Slides
- #Company Introduction
- #Diagram
- #History
- #Cluster
- #Chain Diagram
- #16:9
- #timeline diagram PowerPoint
- #company history slide template
- #milestone presentation slides
- #linear timeline template download
- #corporate history PowerPoint
- #business timeline slide design
About the Product
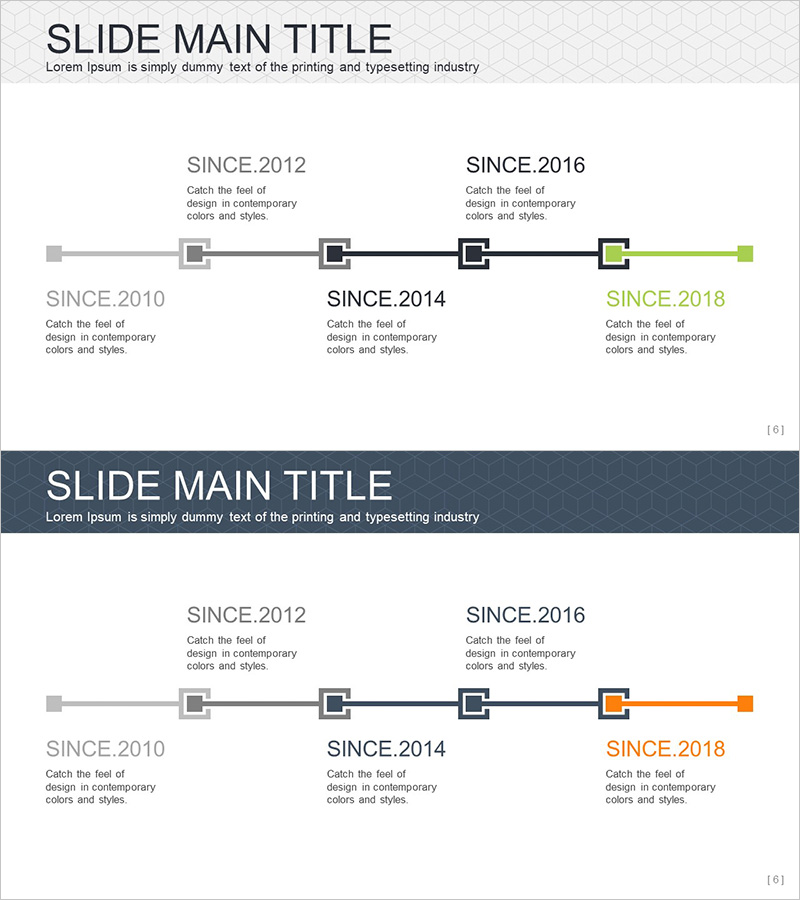
A linear timeline diagram PowerPoint slide that visualizes your company's major development milestones in chronological order. This presentation template features 5 milestone nodes (2010–2018) connected by horizontal lines, with the latest year highlighted in accent colors (green or orange) for emphasis. The neutral gray background and clear hierarchical structure make it ideal for corporate presentations, company profiles, and annual reports. Delivered in 16:9 widescreen format with 2 slide layouts for flexible use across different presentation environments.
Usage Points
-
Main Usage
Effectively communicate your company's growth trajectory and key achievements from founding to present day in a clear, chronological visual format. Build credibility with investors, new employees, and clients by showcasing your organization's history and milestones.
-
How to Use
Enter the year and key event (founding, IPO, acquisition, new business launch, etc.) in each square node. Customize the text areas to match your company's story, and apply color emphasis to the latest year or most significant milestone to draw audience attention.
-
Recommended For
Corporate investor relations presentations, company profile decks, annual reports, employee onboarding materials, corporate promotional videos, investor pitch meetings, and press releases. Particularly effective for established companies with long histories or high-growth startups highlighting rapid expansion milestones.
-
Slide Structure
5 square nodes connected horizontally by a continuous line, forming a linear timeline. Each node contains a year label and descriptive text area. The most recent year (2018) is distinguished with green or orange accent color. Two layout variations provided: upper and lower node positioning for design flexibility.
Related Products
-

History Overlay Diagram – Company Introduction Slide
#Company Introduction #Diagram #History
-

Fountain Pen History Diagram – Emphasizing Corporate Identity
#Company Introduction #Product/Service Introduction #Diagram
-

Introduction to the History of the Architectural Company – A Visual Timeline
#Company Introduction #Diagram #Company Overview
-

History Folder Shape Diagram - Optimized for Company Introduction
#Company Introduction #Product/Service Introduction #Diagram
