Logistics Industry Growth History – Capturing the Journey of Success
RM0700013_5
- Last Update 02/27/2025
- File Size 1MB
- # of Slides 4
- File Format PPTX
- Slide Ratio 16:9
- Color
Keywords
About the Product
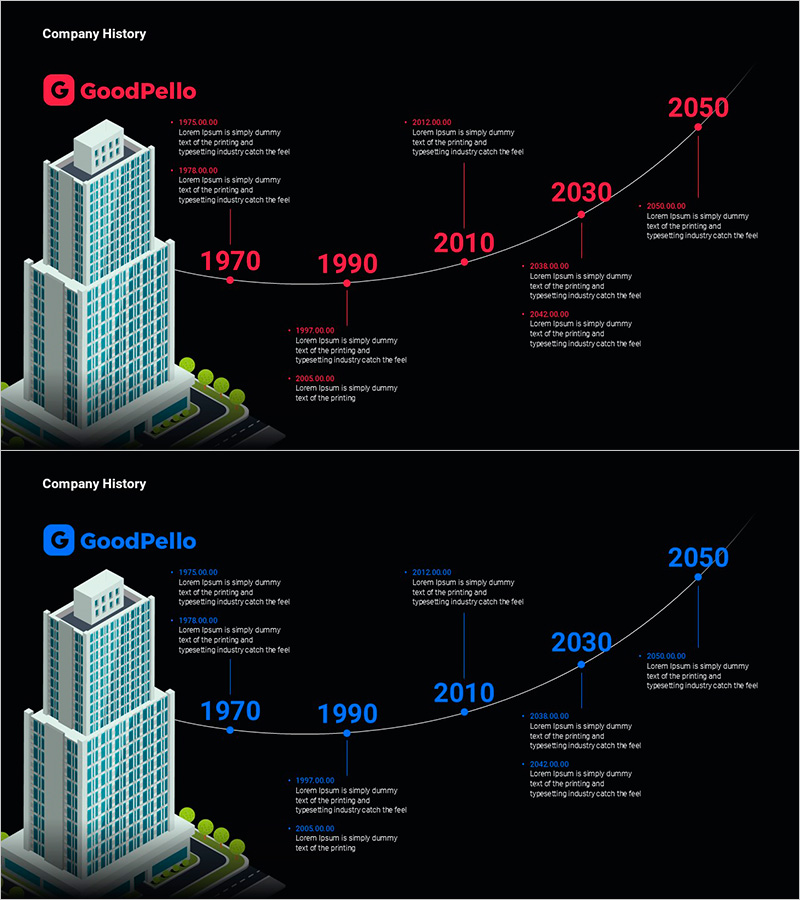
A 4-slide connected timeline diagram PowerPoint template that visualizes corporate growth milestones from 1970 to 2050 along a curved progression path. Each timeline point features a node marker with adjacent text areas for detailed descriptions of key events and achievements. The asymmetrical layout combines a 3D building illustration on the left with a flowing curved timeline on the right, creating dynamic visual impact. Available in red and blue color schemes, this presentation slide is ready to use for company history, industry growth narratives, and project evolution timelines across logistics, manufacturing, finance, and technology sectors.
Usage Points
-
Main Usage
Designed to present long-term corporate growth trajectories and industry development histories in a sequential, time-based format. Each milestone node accommodates year labels, key events, and performance metrics, enabling clear communication of organizational evolution and strategic achievements.
-
How to Use
Input years and major milestones at the four timeline nodes, then add detailed descriptions in the adjacent text areas. The left-side building illustration symbolizes company scale growth and can be recolored to match your brand identity. Customize the timeline curve and node colors to align with presentation themes.
-
Recommended For
Ideal for company introduction presentations, investor pitches, annual reports, and marketing strategy decks where company history sections are featured. Particularly effective for executive briefings in logistics, manufacturing, finance, and IT industries emphasizing growth narratives.
-
Slide Structure
Four-slide set with each slide displaying a curved timeline connecting four milestone points selected from 1970, 1990, 2010, 2030, and 2050. Left side features a 3D building illustration; right side shows the curved timeline path with four node markers and adjacent text input zones for each milestone.
Related Products
-

History of Eco-Friendly Energy Business – Visualization of Key Achievements
#Company Introduction #Diagram #History
-

Corporate Growth Timeline Visualized with Pictograms
#Company Introduction #Diagram #History
-

Visualizing Trends in Aerobic Training – Timeline Diagram
#Company Introduction #Diagram #History
-

Introduction to Company History – Visualizing with Linearity and Clusters
#Company Introduction #Operational Plan #Diagram
