Transportation Process Flow Diagram – Efficient Distribution Strategy
RB0100033_7
- Last Update 03/04/2025
- File Size 1.9MB
- # of Slides 2
- File Format PPTX
- Slide Ratio 4:3
- Color
Keywords
- #Content-Based Slides
- #Design-Based Slides
- #Operational Plan
- #Marketing Plan and Strategy
- #Diagram
- #Business Processes
- #Distribution Strategy
- #Cluster
- #Chain Diagram
- #4:3
- #circular flow diagram PowerPoint
- #3-stage process slide template
- #transportation process diagram
- #distribution strategy PPT
- #connected diagram PowerPoint slide
About the Product
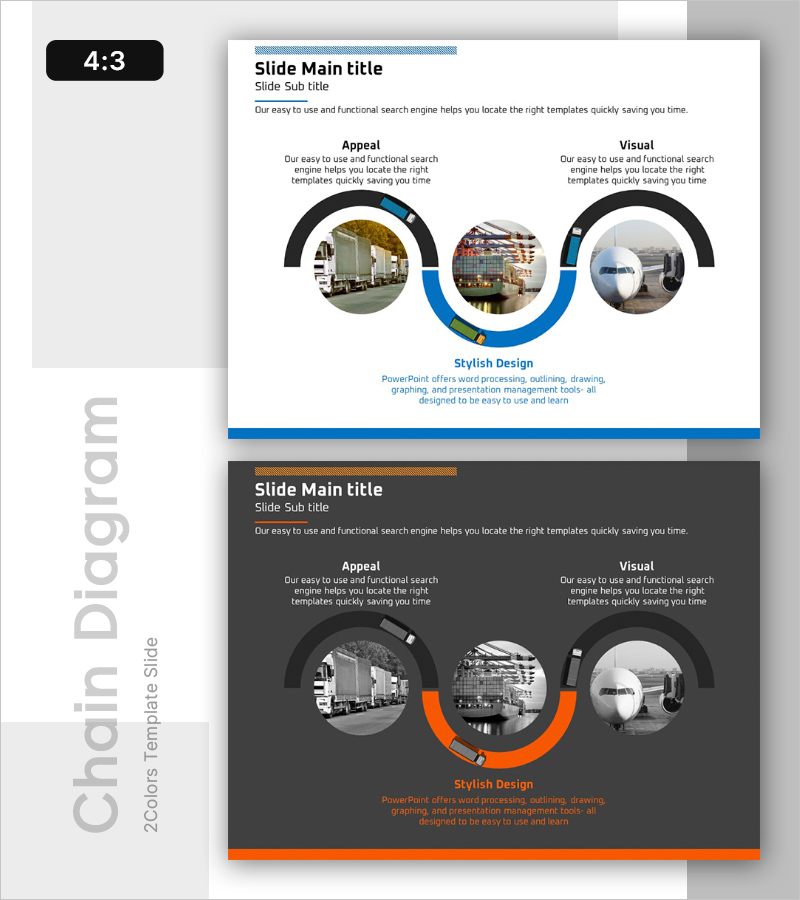
A PowerPoint slide that visualizes transportation and distribution processes through a 3-node circular flow diagram. The central blue arc connector links the left and right black arcs, forming a closed cycle with circular image placeholders at each node. Blue and orange accent lines clarify the sequential flow of each stage, while text areas accommodate descriptions for each phase. Instantly applicable for presentations, operational plans, and marketing strategy documents to illustrate efficient distribution routes or transportation stages.
Usage Points
-
Main Usage
Breaks down cyclical processes such as transportation, distribution, and production into 3 stages for visual representation. Inserting actual photos or icons into the circular image areas at each node transforms abstract concepts into concrete visuals, while the arc connectors clearly express cause-and-effect relationships between stages.
-
How to Use
Enter stage names (e.g., Appeal, Visual, Design) in each node's text area and insert representative images into the circular placeholders. Customize the arc connector colors and text box content to match your specific process flow.
-
Recommended For
Transportation and logistics managers, supply chain management (SCM) professionals, marketing planners, and operations team leads presenting process improvement proposals. Also suitable for educational and seminar materials explaining cyclical concepts such as quality management cycles or customer satisfaction improvement loops.
-
Slide Structure
2-slide set. Top title area (Slide Main title / Slide Sub title), center 3 circular image nodes (left, center, right), arc connectors (2 black arcs + 1 central blue arc), bottom text description area (Appeal / Visual / Stylish Design). 4:3 aspect ratio, PPTX format with all elements fully editable.
Related Products
-

Diagram Slide for Ship Operating System
#Business Strategy #Operational Plan #Marketing Plan and Strategy
-

Idea Meeting Process - Multidirectional Flow Diagram
#Business Strategy #Operational Plan #Diagram
-

Business Process Connection Diagram – Visualizing Business Strategy
#Business Strategy #Operational Plan #Diagram
-

Video Education System Diagram – Business Strategy and Marketing Plans
#Business Strategy #Marketing Plan and Strategy #Diagram
