3 Service Operation Methods Using Climbing Ropes
RJ0600060_13
- Last Update 07/06/2025
- File Size 1.9MB
- # of Slides 2
- File Format PPTX
- Slide Ratio 16:9
- Color
Keywords
- #Content-Based Slides
- #Design-Based Slides
- #Operational Plan
- #Technical Approach
- #Diagram
- #Business Processes
- #Service Operation Plan
- #Cluster
- #Chain Diagram
- #16:9
- #connection diagram PowerPoint
- #rope diagram slide template
- #3-step flow diagram
- #process connection PPT slide
- #how to create connection diagram in PowerPoint
About the Product
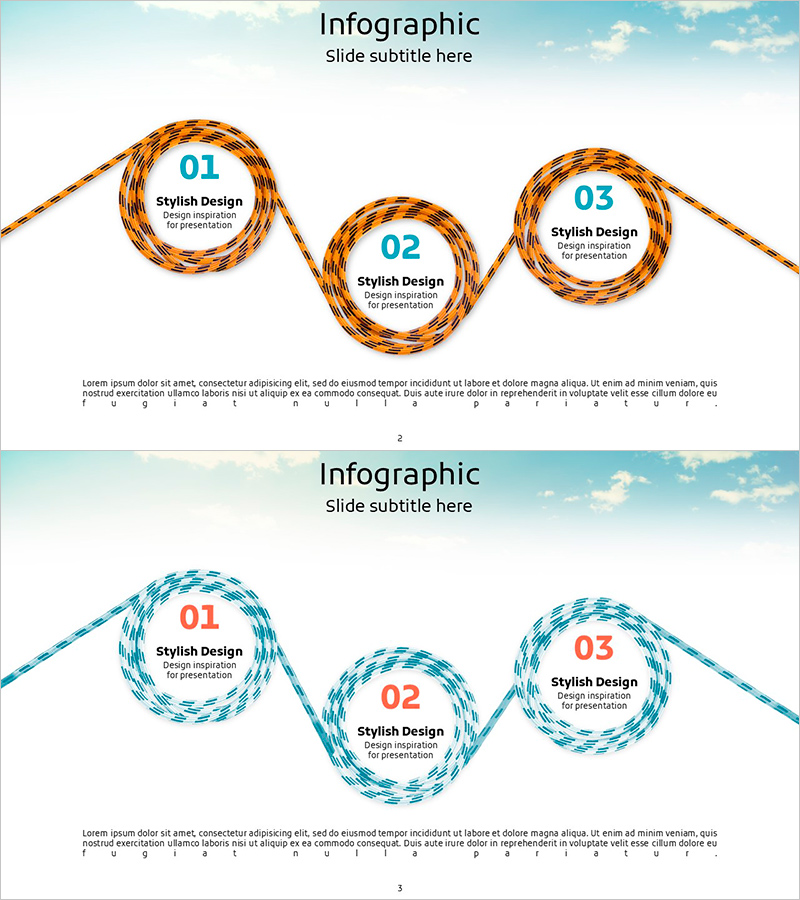
A PowerPoint slide featuring three items connected sequentially using rope-shaped connector lines. Available in two color versions: orange and blue, with each node highlighted by a circular border. This presentation template is ready to use for service operation plans, process stages, and continuous workflow presentations. The 2-slide set provides color variations for diverse presentation contexts, with text editing designed for easy customization and quick implementation.
Usage Points
-
Main Usage
Optimized for visualizing sequential relationships between three items. Ideal for presentations on service operation plans, business processes, and phased strategy development. The rope-shaped organic connector lines emphasize natural progression and continuous workflow.
-
How to Use
Replace the text inside each circular node with your own content. Use the orange version for warm-toned presentations and the blue version for corporate presentations requiring trust and credibility. The rope connector colors and node numbers can be modified as needed.
-
Recommended For
Recommended for service planning teams, operations managers, project managers, and marketing strategists. Suitable for business plans, operational reports, process improvement proposals, and educational seminar materials.
-
Slide Structure
2-slide set. Each slide features three circular nodes connected by rope-shaped connector lines. Title area at the top, three numbered nodes (01·02·03) in the center, and descriptive text area at the bottom. Optimized for 16:9 widescreen format in modern presentation environments.
Related Products
-

How to Measure Smart Health – Visualizing Effective Data Flow
#Operational Plan #Technical Approach #Diagram
-

Business Process Circular Diagram – Effective Service Operations
#Operational Plan #Technical Approach #Diagram
-

Financial Business Process Diagram – Efficient Workflow
#Business Strategy #Operational Plan #Diagram
-

Business Process Arrow Diagram – Systematic Business Management
#Business Management #Operational Plan #Diagram
