Nested Interaction Relationship Diagram – Visualizing Business Strategy
RB0100033_6
- Last Update 03/04/2025
- File Size 0.3MB
- # of Slides 2
- File Format PPTX
- Slide Ratio 4:3
- Color
Keywords
- #Content-Based Slides
- #Design-Based Slides
- #Business Vision and Strategy
- #Technical Approach
- #Diagram
- #Business Strategy
- #Service Operation Plan
- #Cluster
- #Combination Diagram
- #4:3
- #nested Venn diagram PowerPoint
- #3-element diagram slide
- #overlapping relationship visualization
- #business strategy diagram template
- #intersection diagram presentation
About the Product
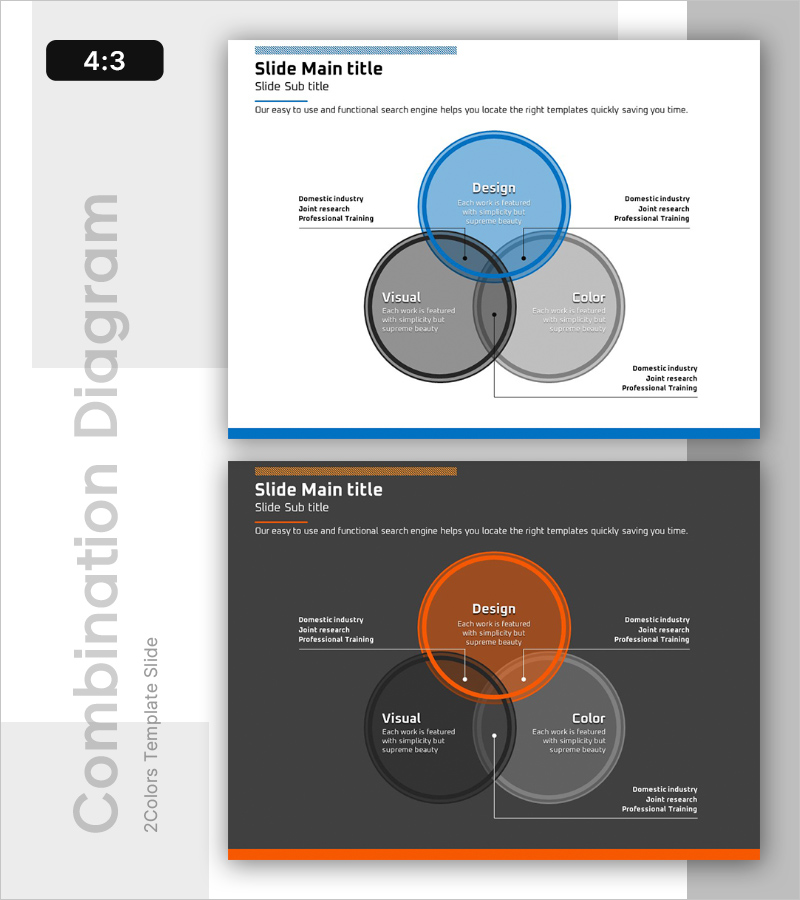
A PowerPoint slide featuring three overlapping circular elements that visualize interconnected relationships and intersections. The blue accent color contrasts with gray tones to highlight the central overlap area, while each circle accommodates text and descriptions for clear communication of business strategy, organizational relationships, and process intersections. Formatted in 4:3 aspect ratio with 2 slides, this presentation template is ready for immediate use in business presentations, reports, and training materials.
Usage Points
-
Main Usage
Optimized for visualizing relationships, intersections, and commonalities among three elements. Effectively communicates business strategy components, organizational structures, process flows, and market positioning by presenting complex relationships in a clear, intuitive format.
-
How to Use
Enter titles and descriptions in each circular area to define the three elements' characteristics. Place common points or core values in the central intersection, and position unique attributes of each element in the outer sections. Customize colors to emphasize specific areas as needed.
-
Recommended For
Ideal for executives, strategy teams, marketing departments, and organizational development teams presenting business strategies, organizational relationships, and market positioning. Effective in strategic presentations, management reports, organizational training, and consulting proposals.
-
Slide Structure
Three overlapping circles forming intersections with a central overlap area. Top blue circle (Design), bottom-left gray circle (Visual), and bottom-right light gray circle (Color) are arranged to create clear intersection zones. Text input fields are positioned within each circle and in the overlap area, with additional description text areas on the left and right sides.
Related Products
-

Purple Green Overlay Diagram – Business Vision and Strategy
#Business Vision and Strategy #Technical Approach #Diagram
-

Service Operation Plan – Detail of Business Strategy and Technology Sector
#Business Vision and Strategy #Technical Approach #Diagram
-

Problem Diagram of Environmental Pollution – Vision for Solution
#Business Vision and Strategy #Technical Approach #Diagram
-

Circular Connection Overlapping Diagram – Business Vision and Strategy
#Business Vision and Strategy #Diagram #Business Strategy
