Association Loop Connection Diagram – Visualizing Technical Flow
RM0900001_9
- Last Update 10/07/2025
- File Size 0.3MB
- # of Slides 2
- File Format PPTX
- Slide Ratio 16:9
- Color
Keywords
- #Content-Based Slides
- #Design-Based Slides
- #Technical Approach
- #Diagram
- #Service Architecture Diagram
- #System Architecture Diagram
- #Flow
- #Multidirectional Flow
- #16:9
- #bidirectional diagram PowerPoint
- #loop connection slide template
- #crossing flow diagram
- #two-node interaction PowerPoint
- #process flow diagram slide
- #how to create loop diagram in PowerPoint
About the Product
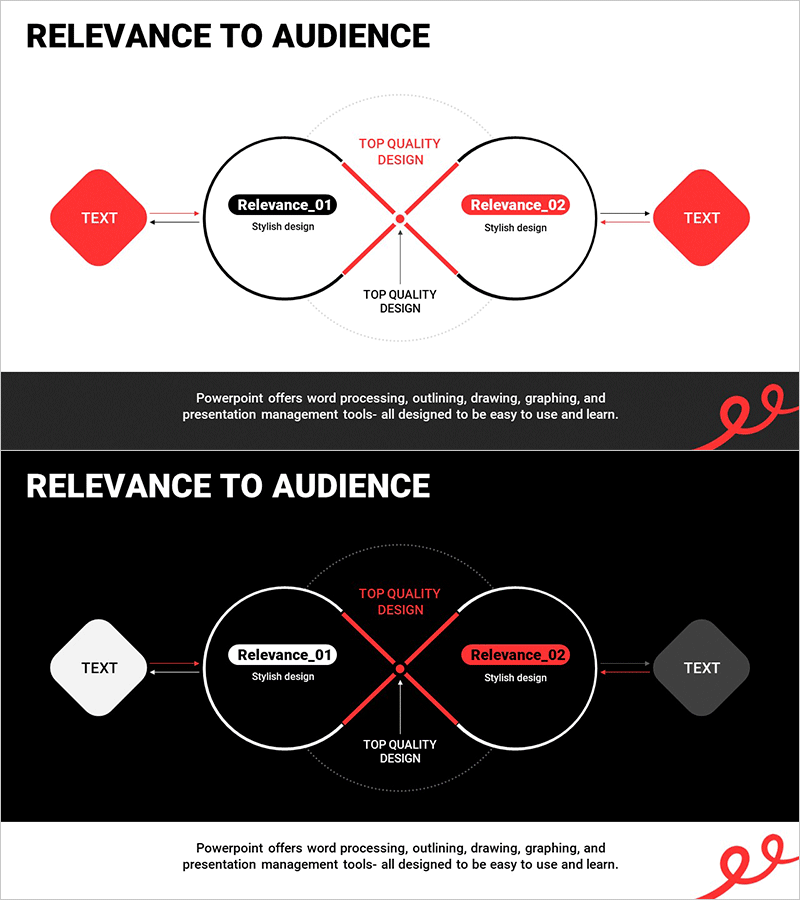
A bidirectional loop diagram PowerPoint slide featuring two circular nodes connected by red crossing arrows at the center. The intersection point highlights 'Top Quality Design' label, while left and right text boxes serve as input areas for custom content. Includes two versions: light background and dark background layouts for flexible presentation contexts. This PPT slide is optimized for visualizing technical processes, interaction flows, and reciprocal relationships in business and technical presentations.
Usage Points
-
Main Usage
Visually represents bidirectional interaction, circular relationships, and feedback loops between two key elements. Effectively communicates system interconnectivity, technical architecture, and business process dependencies in presentations.
-
How to Use
Enter primary concepts or process names in the left and right text boxes, then add core messaging in the central intersection area. Use the light background version for printed materials or bright presentation environments, and the dark background for dimly lit venues or sophisticated presentation atmospheres.
-
Recommended For
Technology teams explaining system architecture, IT planners visualizing interaction flows, business analysts mapping interdependent processes, product development teams illustrating feedback loops, and consultants presenting mutual dependency analysis.
-
Slide Structure
Two circular nodes with central crossing point, three bidirectional red arrows (top, bottom, and crossing), two text input boxes (left and right), and central label area. Two layout options: light background with black nodes and dark text, dark background with white/gray nodes and white text.
Related Products
-

Multidirectional Flow Diagram for Business System Architecture
#Technical Approach #Diagram #Service Architecture Diagram
-

Chromosome Theme Wide PowerPoint Template – Stylish Diagram Composition
#Technical Approach #Diagram #Service Architecture Diagram
-

Visualizing Service Composition with Tree Structure System
#Technical Approach #Diagram #Service Architecture Diagram
-

Organizational Structure Analysis - Efficient System Model
#Technical Approach #Diagram #Service Architecture Diagram
