Management System Diagram – Operating Plan Visualization
RB0100008_8
- Last Update 03/02/2025
- File Size 0.3MB
- # of Slides 2
- File Format PPTX
- Slide Ratio 4:3
- Color
Keywords
- #Content-Based Slides
- #Design-Based Slides
- #Operational Plan
- #Diagram
- #Capital Investment Plan
- #Post-Implementation Management & Maintenance
- #Cluster
- #Spread
- #Closed Cluster Diagram
- #Centralized Diagram
- #4:3
- #central circular diagram PowerPoint
- #4-item management system slide
- #operational planning visualization
- #diagram PowerPoint slide
- #management system presentation template
About the Product
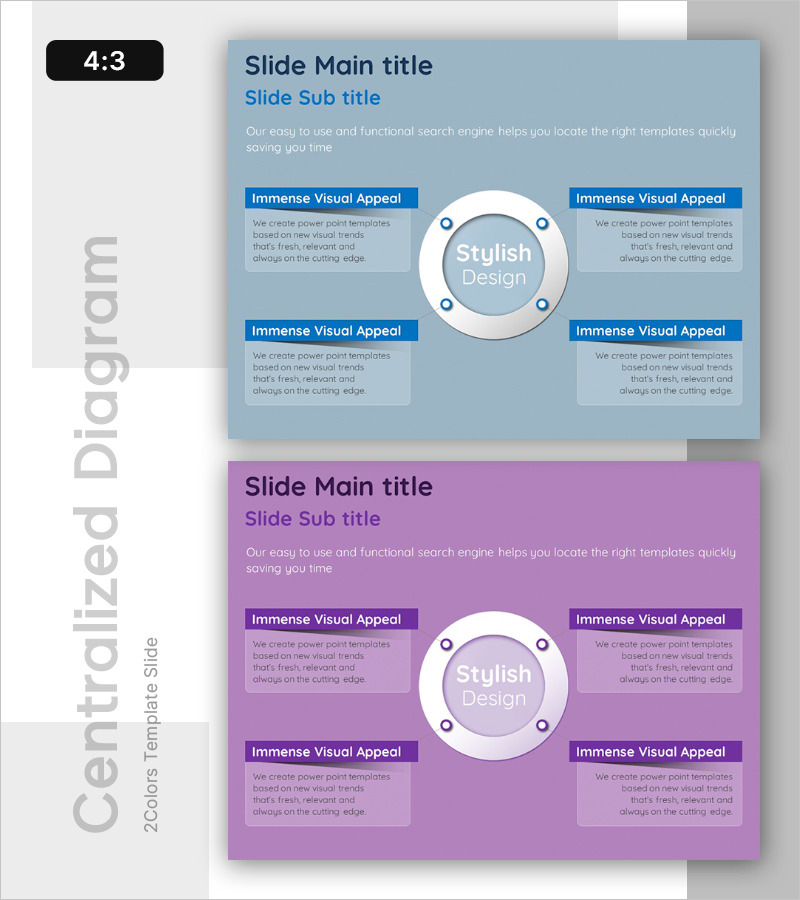
A circular diagram PowerPoint slide connecting four surrounding items to a central concept. Designed with a light blue background, white circular nodes, and dark blue text boxes, this slide effectively visualizes management systems including operational planning, equipment investment, and post-management. The 2-slide set includes an identical layout in purple color, allowing you to match your presentation's tone and style. Each item features a dedicated text area for descriptions, making it ready for immediate editing and use in your presentation.
Usage Points
-
Main Usage
Optimized for visualizing organizational management systems, operational processes, and circular structures centered on a core concept. Clearly expresses the relationships between four interconnected items such as equipment investment, post-management, and operational planning, enhancing audience comprehension.
-
How to Use
Enter your core concept (e.g., management system, operational framework) in the central circular node. Add detailed items and descriptions to the four surrounding text boxes. Choose between the blue or purple color version to match your presentation topic and company branding.
-
Recommended For
Ideal for executive reports, business plan presentations, organizational structure explanations, and quality management process introductions. Suitable for executives, managers, and project leaders in manufacturing, construction, service industries, and other sectors requiring operational system explanations.
-
Slide Structure
One circular node at center with four text boxes positioned in cardinal directions (top, bottom, left, right). Each node comprises a circular icon and text input area, with connecting lines between the central circle and surrounding nodes representing relationships. The 2-slide set features identical structures in light blue and purple color versions.
Related Products
-

Key Features of the Network Platform – Innovative Equipment Investment Plan
#Operational Plan #Diagram #Capital Investment Plan
-

KPI Expansion Diagram for Facility Management – Visualizing Key Management Metrics
#Operational Plan #Diagram #Capital Investment Plan
-

Equipment and Maintenance Support Plan Template – Cluster Diagram Emphasizing Operational Planning
#Operational Plan #Diagram #Capital Investment Plan
-

Review and Analysis of Business Details – Visualized with Modern Diagrams
#Business Management #Operational Plan #Diagram
