Business Progress Visualization Template
RM0800012_5
- Last Update 03/01/2025
- File Size 0.2MB
- # of Slides 2
- File Format PPTX
- Slide Ratio 16:9
- Color
Keywords
- #Content-Based Slides
- #Design-Based Slides
- #Business Strategy
- #Business Management
- #Diagram
- #Roadmap
- #Implementation Plan
- #Table
- #Standard Table
- #16:9
- #horizontal bar chart PowerPoint
- #process timeline slide
- #project progress visualization
- #6-stage process template
- #business timeline PPT slide
- #how to create project timeline in PowerPoint
About the Product
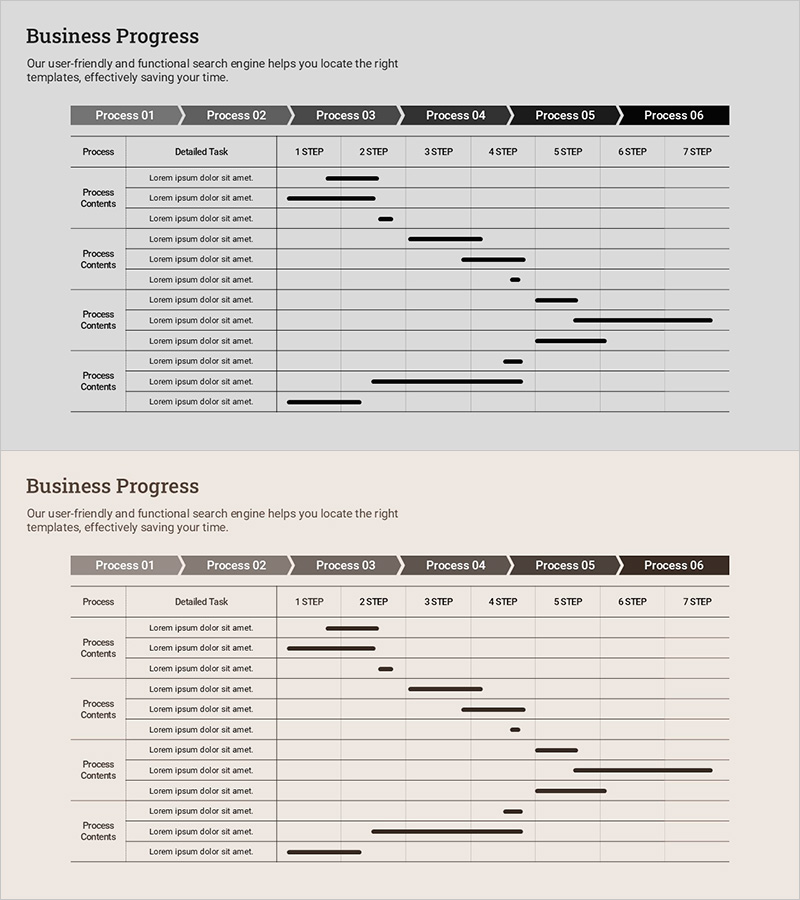
A horizontal bar chart PowerPoint slide that visualizes project progress across six process stages with detailed task breakdowns. Black progress bars represent task timelines against a gray background with arrow-shaped process headers and clear grid structure for optimal data readability. This presentation slide deck contains 2 slides optimized for 16:9 widescreen format, making it immediately applicable to modern business presentations and project status meetings.
Usage Points
-
Main Usage
Visualize project progress and task timelines across six process stages simultaneously, enabling teams to understand project status at a glance. The horizontal bar representation makes it easy to compare task durations and identify scheduling overlaps or dependencies across multiple work streams.
-
How to Use
Use in project kickoff meetings, weekly status reports, and client presentations to explain project roadmaps and current progress. Customize bar lengths and positions to match your actual project schedule and task durations. Easily update task names and timeline data by editing the slide directly.
-
Recommended For
Project managers, team leads, business analysts, and consultants who regularly report project status. Suitable for presentations in construction, IT, marketing, product development, and other industries requiring detailed project timeline communication.
-
Slide Structure
The slide features a header section with 6 process stage boxes (dark arrow-shaped headers) and a detailed task area below. Each process stage contains 3-4 task rows with black horizontal bars indicating task duration and timeline. Clear grid lines and stage dividers organize information hierarchically for easy interpretation.
Related Products
-

Schedule Management Slide – Efficient Planning
#Business Strategy #Business Management #Diagram
-

Calendar Illustration Table – Visualizing Business Strategy
#Business Strategy #Business Management #Diagram
-

Tennis Schedule – Efficient Management and Planning
#Business Management #Diagram #Implementation Plan
-

Schedule Template with Color Theme – Business Management and Action Plans
#Business Management #Diagram #Implementation Plan
