Milestones in Corporate Growth – Diagrams for Organizational Development
RB0100005_5
- Last Update 08/01/2025
- File Size 0.6MB
- # of Slides 2
- File Format PPTX
- Slide Ratio 4:3
- Color
Keywords
- #Content-Based Slides
- #Design-Based Slides
- #Company Introduction
- #Business Management
- #Text Box
- #History
- #Implementation Schedule
- #Sticky Note
- #4:3
- #corporate growth timeline PowerPoint
- #milestone diagram slide
- #year-by-year growth presentation
- #organizational development timeline
- #how to create a milestone slide in PowerPoint
About the Product
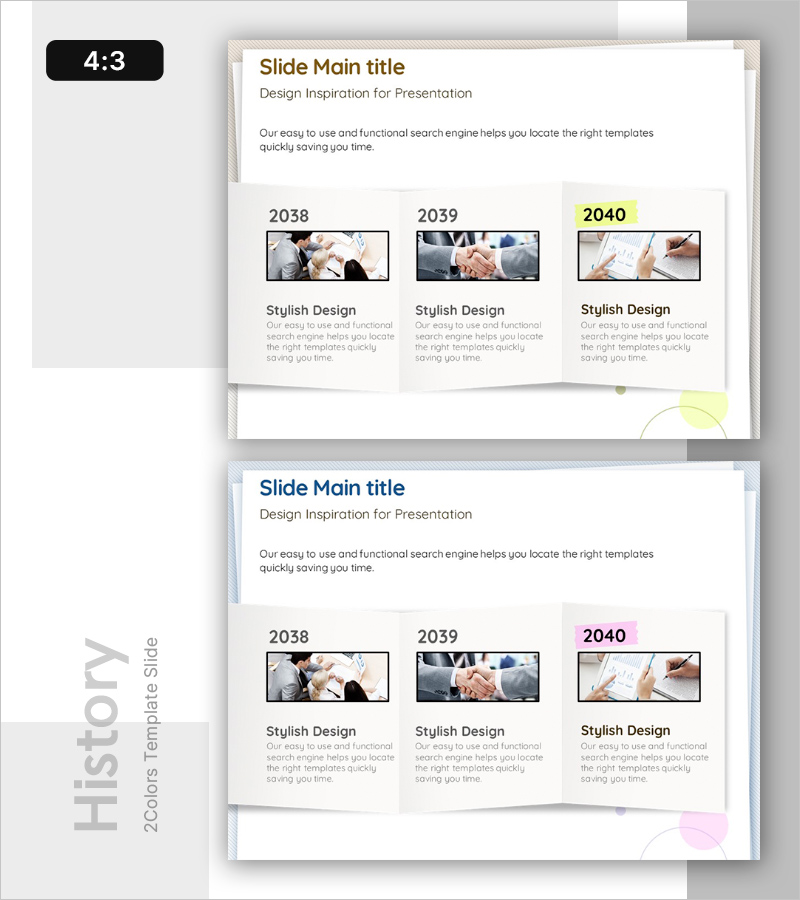
A timeline-based PowerPoint slide that visualizes key corporate milestones across three consecutive years (2038–2040). Each year features an image placeholder, title text, and descriptive content area to showcase organizational development stages. The design uses a light beige background with year-specific accent colors (yellow and pink highlights) to emphasize critical growth points. This layout is optimized for investor presentations, company introductions, and stakeholder communications where growth trajectory and organizational progress need clear visual impact. Delivered in 4:3 aspect ratio, PPTX format, fully editable.
Usage Points
-
Main Usage
Clearly communicate key organizational growth stages and milestones in chronological order, making corporate development history easy to understand. Ideal for investor pitches, company introductions, and annual performance reports where demonstrating business credibility and growth potential is essential.
-
How to Use
Enter major events, achievements, or organizational changes for each year in the designated text boxes. Insert relevant photos or images in the placeholder areas. Customize year labels and descriptions to match your company's specific timeline and presentation context. Use color highlights to emphasize the most significant milestones.
-
Recommended For
Executive leadership, investor relations teams, marketing and communications professionals presenting company history. Suitable for new employee onboarding, partner collaboration proposals, and corporate video materials. Applicable across startups to large enterprises needing to communicate organizational growth narratives.
-
Slide Structure
The slide contains a title and subtitle area followed by three year-based milestone boxes arranged horizontally. Each box includes a year label, horizontal image insertion space, milestone title, and descriptive text field. The 2-slide set allows flexible milestone combinations, and the 4:3 ratio ensures compatibility with standard presentation environments.
Related Products
-

Color Theme Presentation Template Diagram – Visualizing Business Management Flow
#Company Introduction #Business Management #Diagram
-

Process Diagram Representing Design Changes Over Time – Vision for the Future
#Company Introduction #Business Management #Diagram
-

History Slide in Brown and Green – Effective Company Introduction
#Company Introduction #Business Management #Diagram
-

Green Blue Timeline Slide – Dynamic Business Roadmap
#Company Introduction #Business Management #Diagram
