Bulb Branch History Diagram – Company Intro and Business Management
RB0100019_4
- Last Update 03/02/2025
- File Size 0.4MB
- # of Slides 2
- File Format PPTX
- Slide Ratio 4:3
- Color
Keywords
- #Content-Based Slides
- #Design-Based Slides
- #Company Introduction
- #Business Management
- #Diagram
- #History
- #Implementation Schedule
- #4:3
- #timeline history PowerPoint slide
- #company history presentation template
- #business milestone diagram
- #how to create a timeline in PowerPoint
- #corporate development PPT
About the Product
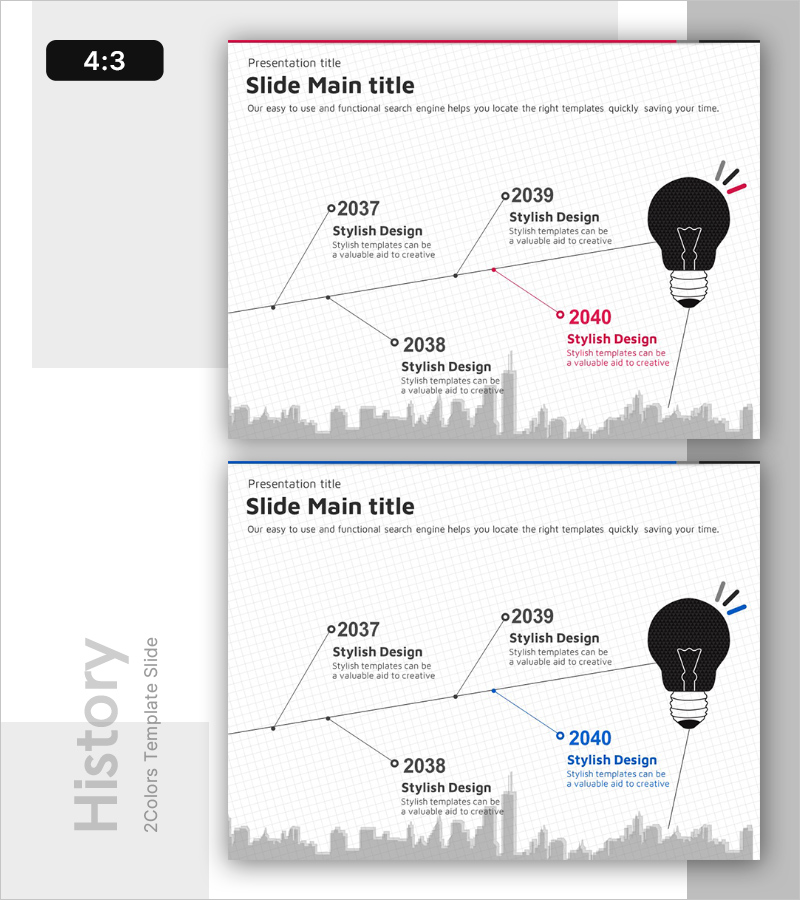
A visually compelling PowerPoint slide that showcases company history and business development milestones in timeline format. This presentation template features four key years (2037–2040) arranged along a horizontal timeline path, each marked with a bulb icon and dedicated text areas for titles and descriptions. The design employs a pink and blue dual-tone accent color scheme paired with a city skyline background, creating a contemporary and professional atmosphere. Ideal for company introduction presentations and business management reports, this slide deck is ready to use immediately. Formatted in 4:3 aspect ratio across 2 slides for compatibility with various presentation environments.
Usage Points
-
Main Usage
This slide effectively communicates a company's key development stages and growth trajectory in chronological order. By highlighting major milestones from founding to present day, it builds credibility and demonstrates growth potential to investors, business partners, and new employees, making it an essential tool for corporate storytelling.
-
How to Use
Insert your company's significant events, product launches, or business expansions into each year section, and add supporting details in the description text areas. The timeline structure enables audiences to grasp the company's progression intuitively. Place this slide in the 'Company Overview' or 'Business Status' section of company introduction decks, business plans, or investor presentations for maximum impact.
-
Recommended For
This slide is recommended for all presentations where corporate credibility and history are central—including company introductions, employee onboarding, investor pitches, and partnership discussions. It works particularly well for startups showcasing growth stories, established companies emphasizing heritage, and organizations explaining business diversification. Executives, HR teams, and marketing professionals frequently use this template.
-
Slide Structure
The slide layout includes a title area at the top, a central horizontal timeline path, and four year nodes (2037, 2038, 2039, 2040) positioned along the timeline. Each node contains a bulb icon, year label, title input field, and description text area. A city skyline background at the bottom reinforces the modern aesthetic. The 2-slide set allows alternating application of pink and blue accent colors for visual variety.
Related Products
-

Smart Travel App Company History - Harmony of Mint and Purple
#Company Introduction #Business Management #Diagram
-

Visualizing Natural Environment Company History – Blue and Brown
#Company Introduction #Business Management #Diagram
-

Yearly Planning Details – Business Management and Timeline
#Company Introduction #Business Management #Diagram
-

Fountain Pen History Diagram – A Glimpse into Business
#Company Introduction #Business Management #Diagram
