Business Process Visualization Slide for Step Progress
RM0800002_7
- Last Update 02/27/2025
- File Size 15.6MB
- # of Slides 2
- File Format PPTX
- Slide Ratio 16:9
- Color
Keywords
- #Content-Based Slides
- #Design-Based Slides
- #Company Introduction
- #Business Strategy
- #Diagram
- #Key Achievements
- #Step-by-Step Schedule Plan
- #Cluster
- #Closed Cluster Diagram
- #16:9
- #circular process diagram PowerPoint
- #5-step process slide
- #business progress visualization
- #step-by-step workflow diagram
- #how to create process flow in PowerPoint
About the Product
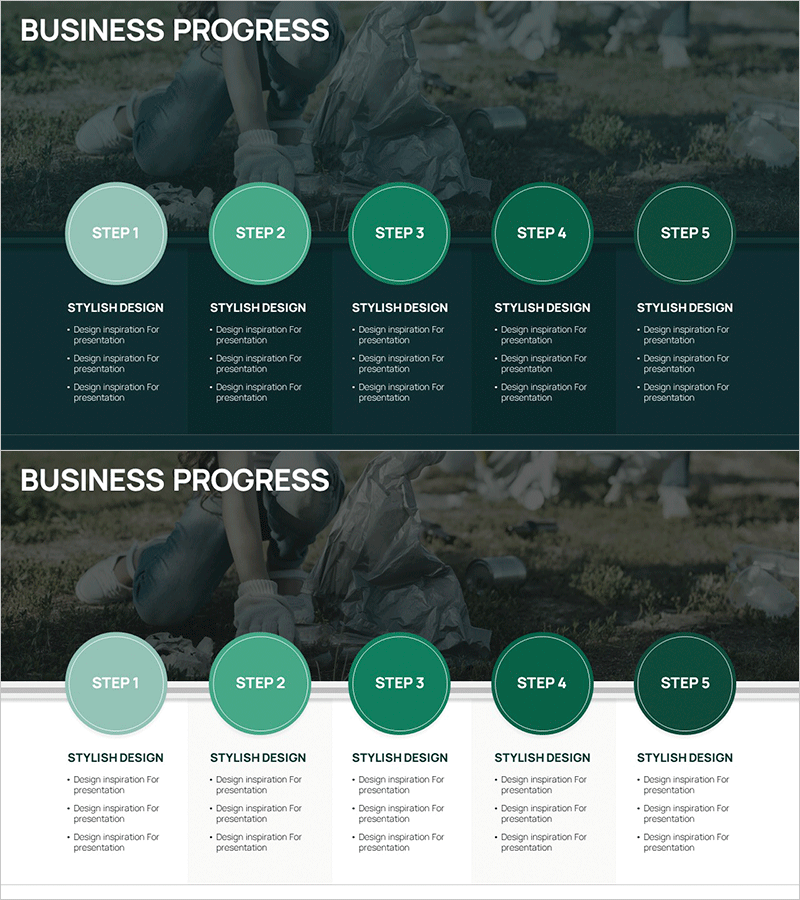
A PowerPoint slide that visualizes business progress stages through a 5-node circular diagram. The circular nodes transition from light mint green to deep forest green in a gradient, connected by linear connector lines, with descriptive text areas positioned below each step. Ideal for presenting project timelines, workflow processes, marketing campaign phases, product development roadmaps, and sequential business progression. The 2-slide set includes two layout options—one with background imagery and one with a clean white background—both optimized for 16:9 widescreen format. All elements are fully editable, allowing you to customize the number of steps, colors, and text content to match your presentation needs.
Usage Points
-
Main Usage
Effectively visualize and communicate sequential business progression, project timelines, workflow processes, marketing campaign phases, and product development roadmaps across 5 distinct stages to your audience.
-
How to Use
Enter stage names in each circular node and add relevant descriptions, responsible parties, or timelines in the text areas below. Customize colors to reflect project status, and choose between the two layout options—with or without background imagery—depending on your presentation context.
-
Recommended For
Project managers, marketing professionals, strategic planning teams, and executives preparing business reports. Perfect for business plans, proposals, quarterly performance reports, organizational restructuring presentations, and strategic roadmap communications.
-
Slide Structure
The 2-slide set features Slide 1 with 5 circular nodes arranged over a background image, and Slide 2 with the same diagram on a clean white background. Each node contains a step number and text input area, connected by linear lines that emphasize the circular flow and progression sequence.
Related Products
-

Diagram Slide for Marketing Promotion Stage
#Business Strategy #Diagram #Step-by-Step Schedule Plan
-

Living Room Shelf Text Box Slide
#Business Strategy #Diagram #Step-by-Step Schedule Plan
-

Action Plan in 3 Simple Steps - Based on Business Strategy
#Business Strategy #Diagram #Step-by-Step Schedule Plan
-

Shooting Plan Slide Template – Effective Business Strategy
#Business Strategy #Diagram #Step-by-Step Schedule Plan
