Platform Launch Impact & Key Metrics – Sharing Successful Strategies
RM0700006_10
- Last Update 02/26/2025
- File Size 10.6MB
- # of Slides 2
- File Format PPTX
- Slide Ratio 16:9
- Color
Keywords
- #Content-Based Slides
- #Design-Based Slides
- #Business Vision and Strategy
- #Business Strategy
- #Operational Plan
- #Text Box
- #Business Goals
- #Achievements
- #Organizational Structure and Staffing Plan
- #16:9
- #performance metrics PowerPoint slide
- #KPI analysis presentation
- #business performance chart slide
- #platform launch report
- #metrics visualization PPT
About the Product
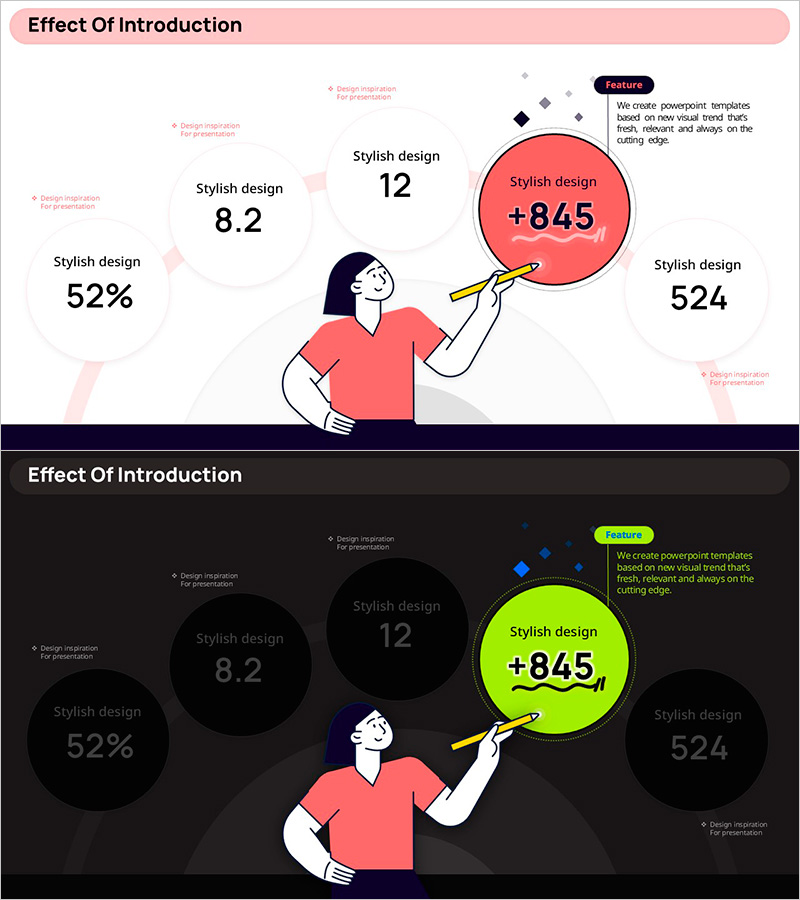
A PowerPoint slide deck visualizing platform launch impact and key performance indicators with dual-tone design. The first slide features a pink background with an illustration and five core metrics (52%, 8.2, 12, +845, 524) arranged in circular charts, delivering success stories intuitively. The second slide reconfigures the same metrics on a dark background for versatile presentation environments. Instantly applicable to business presentations including performance reporting, strategy sharing, and investor updates.
Usage Points
-
Main Usage
Visualize core performance indicators (user growth, satisfaction scores, revenue increase) post-platform launch using numerical data and charts to clearly report business achievements to executives, investors, and partners.
-
How to Use
Use the first slide with bright pink tone to emphasize positive performance results, and the second slide with dark tone for serious analytical presentations. Replace each circular chart's figures with actual performance data and deploy immediately as presentation material.
-
Recommended For
Business strategy presentations, quarterly and annual performance reports, investor relations materials, executive briefings, partner collaboration proposals, and any business presentation requiring quantitative performance emphasis.
-
Slide Structure
2-slide composition. Each slide features a central illustration (female character) with five circular charts (three on left, two on right), title area at top, and Feature box on right side for additional explanatory text input.
Related Products
-

Keyword Strategy Diagram – Spreading Towards Business Goals
#Business Vision and Strategy #Operational Plan #Diagram
-

Yellow Green Circular Diagram – Business Vision and Strategy
#Business Vision and Strategy #Operational Plan #Diagram
-

Travel Milestones Presentation Template – Business Vision and Strategy
#Business Vision and Strategy #Business Management #Operational Plan
-

Cars and Circular Text Boxes – Business Vision and Strategy
#Business Vision and Strategy #Operational Plan #Technical Approach
