Product Feasibility Diagram – Ideal for Business Planning
RM0700003_17
- Last Update 02/26/2025
- File Size 1.1MB
- # of Slides 2
- File Format PPTX
- Slide Ratio 16:9
- Color
Keywords
- #Content-Based Slides
- #Design-Based Slides
- #Business Management
- #Technical Approach
- #Diagram
- #Implementation Plan
- #Service Architecture Diagram
- #Cluster
- #Chain Diagram
- #16:9
- #connection diagram PowerPoint
- #product feasibility slide
- #process flow diagram
- #business planning template
- #4-step connected diagram PPT
About the Product
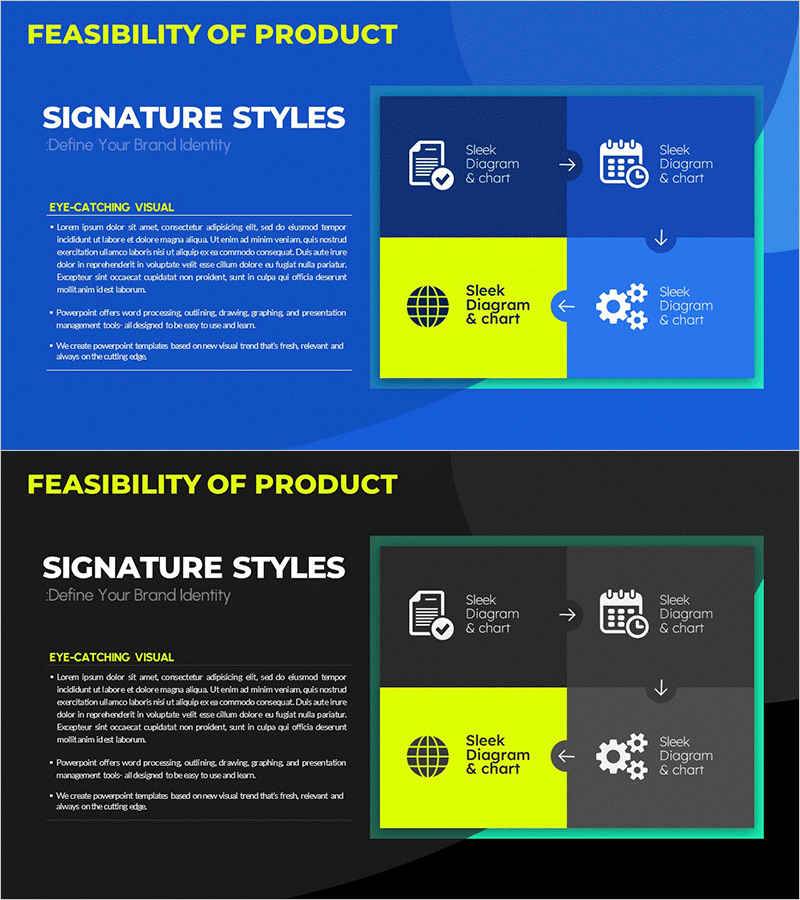
A connected diagram PowerPoint slide that visualizes product development and business execution stages. Four nodes—document verification, schedule management, product implementation, and diagram & chart—are linked by arrows and circular flow to clearly express process relationships. The dark blue background contrasts with a yellow highlight box and teal border, while icons and text intuitively convey each stage's role. This PowerPoint slide is ready to use in business plans, technical analysis documents, and product introduction presentations.
Usage Points
-
Main Usage
Visualizes product development processes, business execution stages, and technology implementation flows through node-to-node connections. Clearly expresses each stage's role and interdependencies, enhancing audience comprehension and conveying complex processes in a simple, intuitive manner.
-
How to Use
Use in the technology analysis section of business plans, development process explanations in product introduction presentations, and execution roadmaps in investment pitch decks. Edit node text and icons with your own content to create customized presentations.
-
Recommended For
Product development teams, technical leads, business planners, and project managers explaining stage-by-stage processes. Ideal for startup technology roadmap presentations, corporate new product development reports, and consulting firm strategy proposals.
-
Slide Structure
Two-slide set with the first slide featuring a blue background and four connected nodes (document, schedule, product, diagram) linked by circular arrows. The second slide repeats the same structure on a black background, providing background color options. Each node includes an icon and text label, with yellow highlight boxes and teal borders creating visual hierarchy.
Related Products
-

Big Data Development Plan by Year Slide
#Company Introduction #Business Management #Diagram
-

Traditional Symbols and Key Messages – Diagrams Driving Business Vision and Strategy
#Business Vision and Strategy #Business Management #Diagram
-

Introduction to Silver Town – Modern Living Concepts
#Product/Service Introduction #Technical Approach #Diagram
-

Visualization of School-Linked Program System – Business Management Strategy
#Business Management #Operational Plan #Diagram
