Step-by-Step Schedule Diagram – Business Strategy and Management
RJ0300034_13
- Last Update 04/27/2025
- File Size 5.6MB
- # of Slides 2
- File Format PPTX
- Slide Ratio 16:9
- Color
Keywords
- #Content-Based Slides
- #Design-Based Slides
- #Business Strategy
- #Business Management
- #Diagram
- #Other
- #Step-by-Step Schedule Plan
- #Implementation Plan
- #Cluster
- #Chain Diagram
- #Silhouette
- #16:9
- #4-step circular process diagram PowerPoint
- #business process flow slide template
- #project timeline diagram
- #step-by-step schedule PowerPoint
- #circular workflow slide design
About the Product
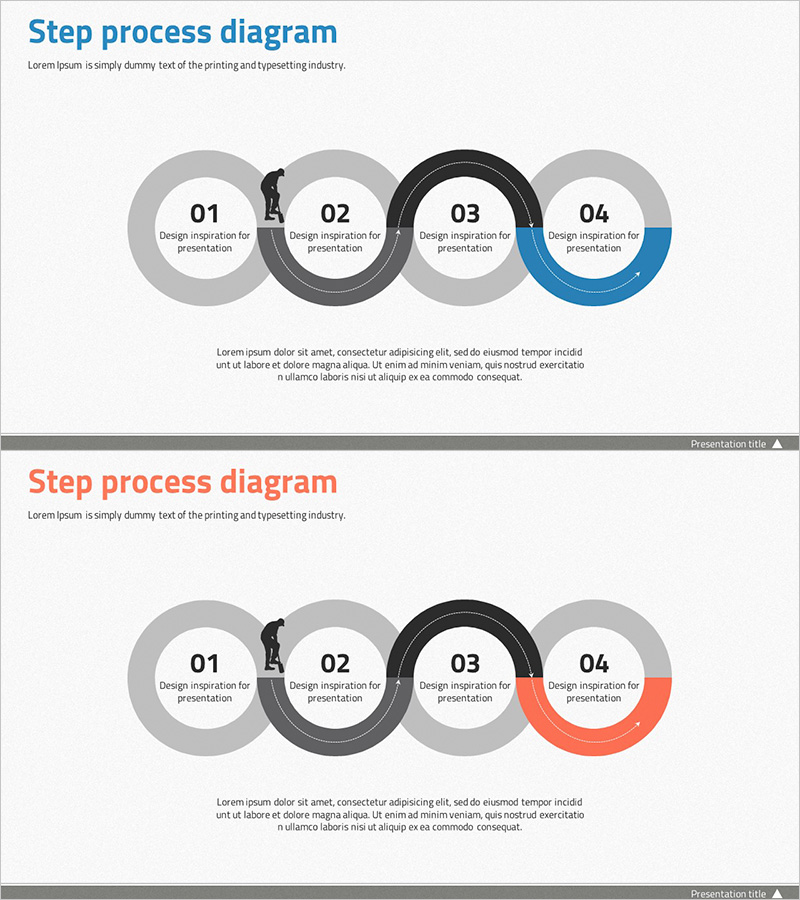
A 4-step circular process diagram PowerPoint slide that visually represents business implementation stages and project timelines. Connected circular nodes in gray, black, blue, and orange tones create a clear sequential flow for strategy communication. Each step includes a dedicated text area for descriptions, making it ideal for business plans, project management presentations, and strategic reports. The 2-slide set offers color variations (blue accent and orange accent) to match different presentation contexts. Fully editable in all PowerPoint versions with 16:9 widescreen format (PPTX).
Usage Points
-
Main Usage
Visualizes business implementation stages, project timelines, and process workflows across 4 sequential steps in a circular structure. Effectively communicates stage objectives and execution details while representing cyclical processes and continuous improvement initiatives.
-
How to Use
Enter stage names and descriptions in the numbered nodes (01–04) and text areas. Insert into business plans' strategy sections, reports' project status updates, proposals' execution plans, or investor presentations. Select the color variation (blue or orange accent) that matches your presentation theme.
-
Recommended For
Business managers, project managers, strategy planners, and marketing professionals creating business plans, reports, proposals, and investor presentations. Suitable for organizational process improvements, new business launches, marketing campaign scheduling, and any multi-stage strategic initiative requiring visual timeline representation.
-
Slide Structure
Four circular nodes arranged left-to-right with connecting arrow icons in the center. Each node contains a number (01–04) and text input area for descriptions. A full-width text area at the bottom accommodates additional process information. The 2-slide set features color variations with the final node highlighted in either blue or orange.
Related Products
-

Step-by-Step Mountain Climbing Business Plan Slide
#Business Strategy #Business Management #Diagram
-

Diagram Slide Template Visualizing Financial Business Process Steps
#Business Strategy #Business Management #Diagram
-

Space Industry Phase-by-Phase Schedule – Strategic Implementation
#Business Strategy #Business Management #Diagram
-

Business Strategy Silhouette Diagram – Effective Strategy Visualization
#Business Vision and Strategy #Business Strategy #Diagram
