Patent Registration Status by Year Slide
RM0700002_22
- Last Update 02/25/2025
- File Size 0.7MB
- # of Slides 2
- File Format PPTX
- Slide Ratio 16:9
- Color
Keywords
- #Content-Based Slides
- #Design-Based Slides
- #Company Introduction
- #Diagram
- #Awards and Certifications, and Patents
- #Cluster
- #Closed Cluster Diagram
- #16:9
- #closed cluster diagram PowerPoint
- #patent registration status slide
- #year-by-year analysis presentation
- #6-node diagram template
- #corporate presentation slide
- #patent portfolio PowerPoint
About the Product
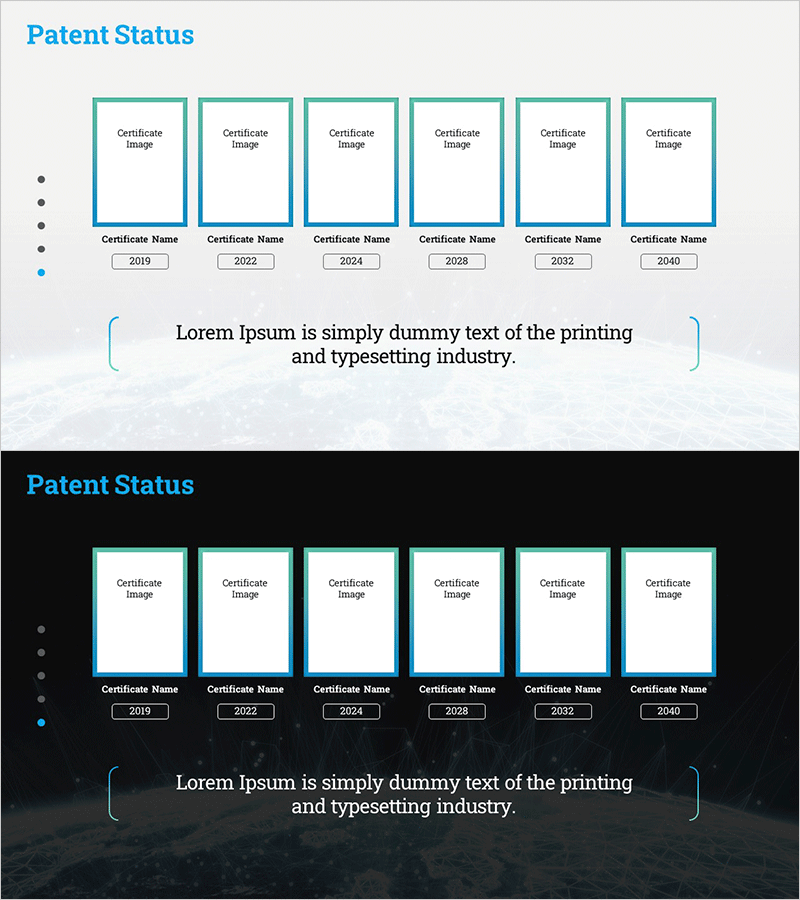
A 6-node closed cluster diagram PowerPoint slide that visualizes patent registration status by year from 2019 to 2040. Each node features a card-style layout with certificate image placeholders, enabling stakeholders to grasp the progression of patent filings at a glance. The teal border and white background create clear information hierarchy, while the bottom description area provides additional context. This PowerPoint template is ready to use for corporate presentations, competitive analysis, technology portfolio showcases, and innovation reporting.
Usage Points
-
Main Usage
Systematically visualize year-by-year patent registration progress to effectively communicate corporate technological competitiveness and innovation capacity. The 6-node closed structure emphasizes cumulative achievements over time, while certificate images for each year enhance credibility and trust.
-
How to Use
Use in corporate presentations, investor pitches, technology portfolio introductions, and R&D performance reports to explain patent registration trends. Replace each card's year and certificate image with actual data, and customize the bottom description text to match your company's context.
-
Recommended For
Technology-driven startups, manufacturing companies, biotech and pharmaceutical firms, patent management departments, R&D teams, technology marketing professionals, and investor relations specialists seeking to highlight technological innovation capabilities.
-
Slide Structure
Title area (Patent Status) + 6 card-style nodes (2019, 2022, 2024, 2028, 2032, 2040) + certificate image placeholders within each node + bottom description text area. Teal borders emphasize each node, while left-side progress indicators mark the current stage.
Related Products
-

Award Structure Diagram Slide – Certification and Patent
#Company Introduction #Diagram #Awards and Certifications, and Patents
-

Awards Introduction Slide – Highlighting Company Achievements
#Company Introduction #Diagram #Awards and Certifications, and Patents
-

Cluster Diagram Visualizing Performance by Year
#Company Introduction #Diagram #Awards and Certifications, and Patents
-

Interior Business Awards Visualization Slide
#Company Introduction #Diagram #Awards and Certifications, and Patents
