Cluster Diagram Visualizing Performance by Year
RB0800013_4
- Last Update 03/20/2025
- File Size 7.5MB
- # of Slides 2
- File Format PPTX
- Slide Ratio 4:3
- Color
Keywords
- #Content-Based Slides
- #Design-Based Slides
- #Company Introduction
- #Diagram
- #Awards and Certifications, and Patents
- #Key Achievements
- #Cluster
- #Closed Cluster Diagram
- #4:3
- #cluster diagram PowerPoint
- #year-over-year performance slide
- #3-node diagram template
- #performance visualization PPT
- #business performance presentation
About the Product
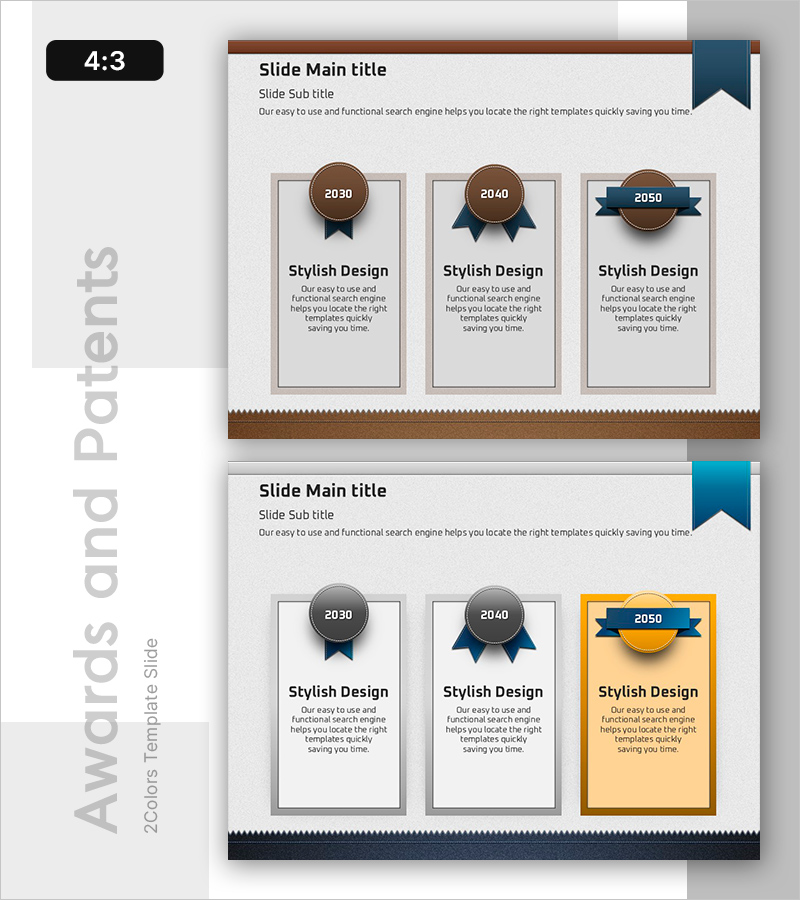
A cluster diagram PowerPoint slide that visualizes year-over-year performance using three circular badge-style nodes. Each node displays a year (2030, 2040, 2050) with a brown or navy badge, and below each node is a gray-bordered text box for detailed performance descriptions. The slide features a brown header bar at the top and decorative footer, creating visual cohesion throughout the presentation. Two slide layouts are provided with different color combinations (brown, navy, and yellow) to suit various corporate reporting needs. Ideal for business performance reports, annual strategy presentations, project milestone reviews, and investor communications where temporal performance comparison is essential.
Usage Points
-
Main Usage
Designed to visualize performance, growth, or change across three distinct time periods or categories using independent nodes. Each badge-style node serves as a focal point, with text areas below for detailed metrics, achievements, or qualitative descriptions, enabling both quantitative and narrative data representation.
-
How to Use
Enter year, period, or category name in each circular node, then add corresponding performance data, key metrics, or achievements in the text boxes below. Modify badge colors (brown, navy, yellow) to indicate priority levels or status categories. Choose between the two provided slide layouts based on your color preference and presentation theme.
-
Recommended For
Executive performance reports, annual business reviews, departmental achievement presentations, investor pitch decks, project milestone communications, strategic planning sessions, and quarterly business reviews where clear temporal comparison of performance metrics is required.
-
Slide Structure
Two-slide layout. Each slide contains a brown header section (title and subtitle area), three circular badge-style nodes in the center (year/period input fields), gray-bordered text boxes below each node (description areas), and a decorative footer bar. Slide 1 uses brown and navy color scheme; Slide 2 features navy and yellow accents for design variation.
Related Products
-

Introduction to Awards by Year – Achievement and Inspiration
#Company Introduction #Diagram #Awards and Certifications, and Patents
-

Slide Introducing Awards by Category
#Company Introduction #Diagram #Awards and Certifications, and Patents
-

Diagram Slide for Major Awards and Achievements
#Company Introduction #Diagram #Awards and Certifications, and Patents
-

List of Patents and Certificates – Visualizing Company Achievements
#Company Introduction #Diagram #Other
