Linear History Diagram – Explaining Business Management and Plans
RM0600007_5
- Last Update 02/25/2025
- File Size 1.4MB
- # of Slides 2
- File Format PPTX
- Slide Ratio 16:9
- Color
Keywords
- #Content-Based Slides
- #Design-Based Slides
- #Company Introduction
- #Business Management
- #Diagram
- #History
- #Implementation Plan
- #Flow
- #Linear Flow
- #16:9
- #linear history diagram PowerPoint
- #5-stage timeline slide
- #business roadmap presentation
- #year-by-year progress diagram
- #business management PowerPoint slide
About the Product
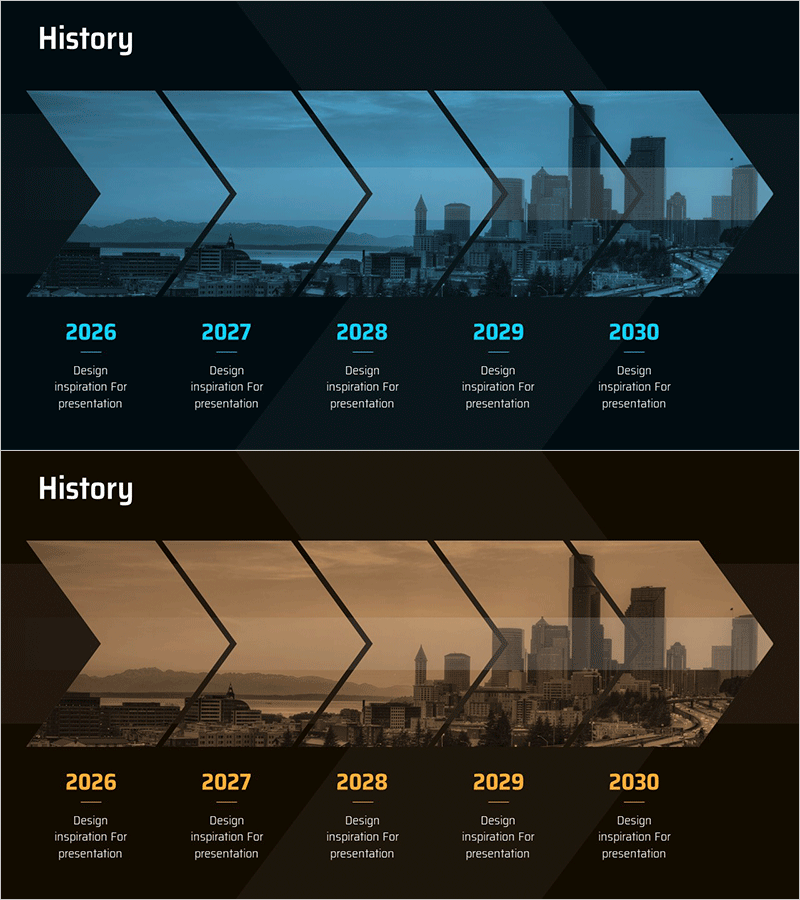
A linear history diagram PowerPoint slide that visualizes the five-year business progression from 2026 to 2030 along a chronological timeline. Five arrow-shaped nodes flow from left to right, with each stage paired with a cityscape image to illustrate business management milestones and strategic initiatives. Two design versions—blue background and brown background—are provided to match your corporate identity and presentation tone. Delivered in 16:9 widescreen PPTX format, fully editable and ready to customize with your content.
Usage Points
-
Main Usage
Clearly communicate your business roadmap and strategic initiatives to executives, investors, and team members by visualizing year-by-year and stage-by-stage progress in chronological order. Add key objectives, achievements, and plans at each stage to systematically present business management status and future direction.
-
How to Use
Enter the year and corresponding business goals, milestones, and plans into each arrow node. The cityscape background imagery reinforces messages of corporate growth, expansion, and global reach. Select the blue version to convey trust and professionalism, or the brown version to emphasize stability and heritage—whichever aligns with your brand positioning.
-
Recommended For
Ideal for business plans, management reports, investor pitch decks, strategy presentations, and annual business planning sessions. Particularly effective for presentations to executives, business managers, marketing teams, consultants, and investors when explaining medium to long-term business roadmaps and strategic direction.
-
Slide Structure
Two-slide set. Each slide features five arrow-shaped nodes arranged in a left-to-right linear flow. Black dividing lines between nodes clearly delineate each stage. A cityscape skyline image serves as the background, with year labels and descriptive text input areas positioned below each node for easy customization.
Related Products
-

Handwriting Concept History Slide - Design Infused with Creativity and Growth
#Company Introduction #Diagram #History
-

Business Promotion Schedule Diagram – A Stepwise Approach to Success
#Company Introduction #Operational Plan #Diagram
-

Semicircle Flow Project List
#Company Introduction #Diagram #History
-

Big Data Development Plan by Year Slide
#Company Introduction #Business Management #Diagram
