AS-IT TO-BE Detailed Planning Table – Business Strategy
RM0600007_19
- Last Update 02/25/2025
- File Size 1MB
- # of Slides 2
- File Format PPTX
- Slide Ratio 16:9
- Color
Keywords
- #Content-Based Slides
- #Design-Based Slides
- #Business Strategy
- #Business Management
- #Diagram
- #Implementation Plan
- #Cluster
- #Closed Cluster Diagram
- #16:9
- #AS-IS TO-BE comparison table PowerPoint
- #business strategy diagram slide
- #cluster diagram presentation template
- #detailed planning PPT slide
- #how to create AS-IS TO-BE slide in PowerPoint
About the Product
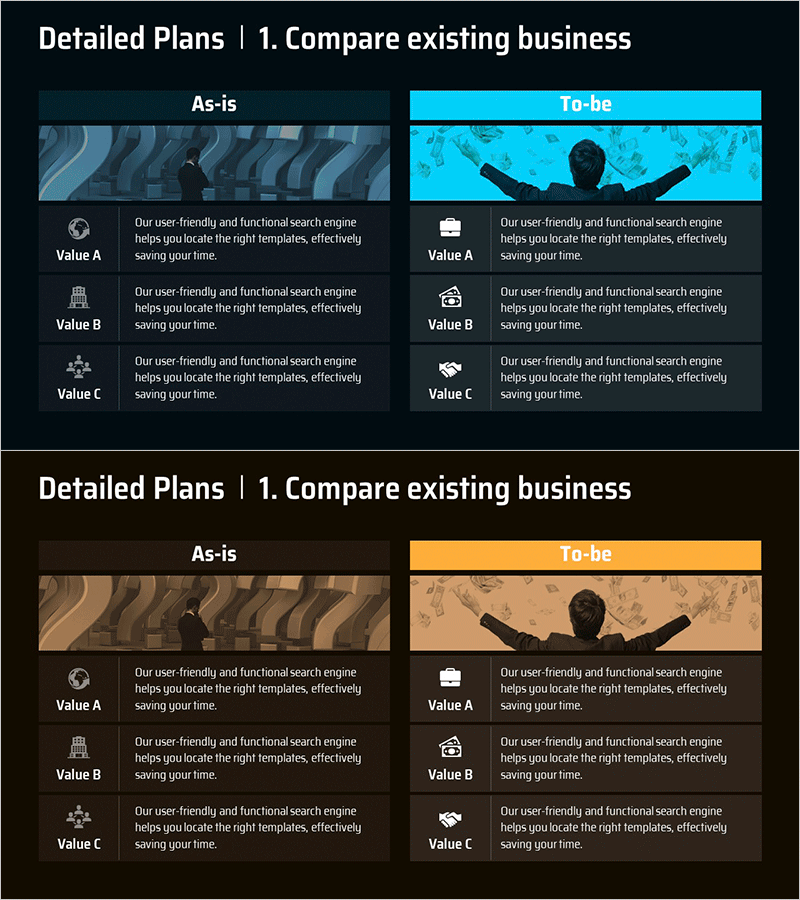
A cluster table diagram PowerPoint slide that compares current state (AS-IS) and target state (TO-BE) across two stages. The design uses dark-toned background on the left and bright-toned background on the right to create visual contrast, with three value items (Value A, B, C) arranged with icons in each stage for clear comparative analysis. This presentation template is ready to use for business strategy, detailed planning, and change management presentations. The slide set contains 2 slides in 16:9 widescreen PPTX format.
Usage Points
-
Main Usage
Clearly contrast current state with future goals to visualize organizational direction and transformation. Effectively presents both current situation analysis and improvement plans in business strategy, organizational improvement initiatives, and project objective setting.
-
How to Use
Enter three key values of the current state in the left AS-IS section and improved values in the right TO-BE section. Customize icons and text for your organizational context, then use in executive presentations, strategy meetings, and change management communications.
-
Recommended For
Recommended for executives, strategy planning teams, project managers, and organizational development professionals presenting business initiatives, organizational transformation strategies, and process improvement plans. Particularly effective for change management communication and executive decision-making meetings.
-
Slide Structure
Two-slide set with each slide divided into two sections: left AS-IS (dark background) and right TO-BE (bright background). Each section contains three value items (Value A, B, C) with icons and descriptive text, using color contrast and background imagery to emphasize the difference between current and future states.
Related Products
-

Stairline Shelf Diagram – Business Strategy Visualization
#Business Strategy #Business Management #Diagram
-

Diagram Slide for How to Grow Carrots
#Business Strategy #Business Management #Diagram
-

Eco-farming Agricultural Business Goal Diagram – A Clear Overview of the Strategy
#Business Strategy #Business Management #Diagram
-

Phase-by-Phase Infrastructure Roadmap
#Business Strategy #Business Management #Diagram
