Core Timeline Diagram – Visualizing History and Operational Plans
RM0600004_5
- Last Update 02/24/2025
- File Size 4.7MB
- # of Slides 2
- File Format PPTX
- Slide Ratio 16:9
- Color
Keywords
- #Content-Based Slides
- #Design-Based Slides
- #Company Introduction
- #Operational Plan
- #Diagram
- #History
- #Project Implementation Schedule
- #Cluster
- #Chain Diagram
- #16:9
- #timeline diagram PowerPoint
- #history visualization slide
- #connected timeline template
- #business milestone PowerPoint
- #project timeline diagram download
About the Product
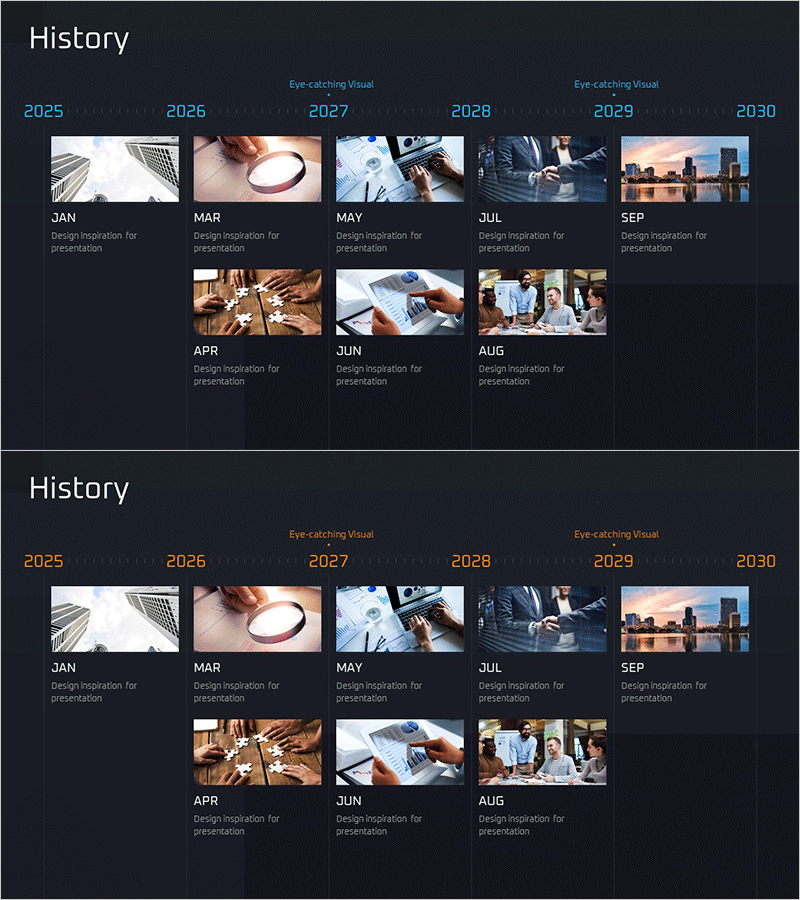
A connected timeline diagram PowerPoint slide that visualizes company history and operational plans along a chronological flow. Six nodes are linked sequentially to clearly represent key milestones, business events, and project timelines for each period. Bright images and text contrast against a dark background, creating strong visual impact for presentations. This PPT slide is optimized for time-based information delivery such as company history, product development roadmaps, and project phases, and can be edited and used immediately.
Usage Points
-
Main Usage
Presents time-based information such as company history, product development roadmaps, project timelines, and business growth stages in sequential order. By placing images and text at each node, it enables visual storytelling and enhances audience comprehension of your narrative.
-
How to Use
Simply replace the images and text in each node with your own content. Use it in company introduction sections to explain history, in strategy sections to show roadmaps, or in business plan presentations to outline implementation schedules across various contexts.
-
Recommended For
Recommended for executives, marketing managers, project managers, business planners, and investor relations professionals presenting company history and future plans. Highly effective for startup pitches, corporate briefings, and strategic presentations.
-
Slide Structure
Two-slide layout. The first slide features a linear timeline diagram with six connected nodes, each containing an image area and month labels (JAN·MAR·MAY·JUL·SEP) with text. The second slide presents the same structure with adjusted color tones for layout variation.
Related Products
-

Major Milestones Diagram – Capturing the Footprints of Business
#Company Introduction #Operational Plan #Diagram
-

Timeline Chart Visualizing Yearly Changes – Journey of Success
#Company Introduction #Operational Plan #Diagram
-

Company History Mini Diagram – Clear and Concise Timeline
#Company Introduction #Diagram #History
-

Business History Diagram – Cluster Visualization
#Company Introduction #Diagram #History
