Business Revenue Structure Diagram – Visualizing Business Strategy
RM0600004_10
- Last Update 09/23/2025
- File Size 0.2MB
- # of Slides 2
- File Format PPTX
- Slide Ratio 16:9
- Color
Keywords
- #Content-Based Slides
- #Design-Based Slides
- #Business Introduction
- #Business Vision and Strategy
- #Diagram
- #Business Overview
- #Flow
- #Structure
- #Multidirectional Flow
- #Tree Diagram
- #16:9
- #tree diagram PowerPoint
- #hierarchical structure slide
- #business revenue structure diagram
- #organizational chart template
- #business hierarchy visualization
About the Product
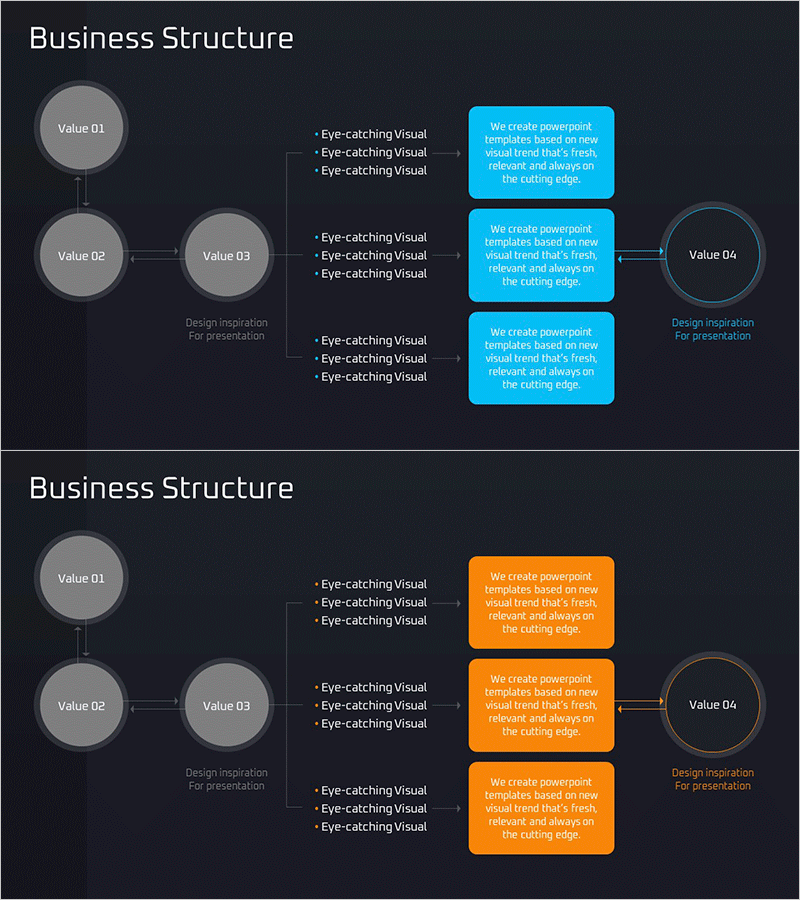
A PowerPoint slide that visualizes business revenue structure using a 4-level hierarchical tree diagram. The design features gray circular nodes on a dark background combined with cyan and orange text boxes to clearly show the relationship between core values and detailed items. The 2-slide set presents the same structure in different color schemes (cyan and orange) for flexible presentation options. Ideal for business strategy presentations, organizational hierarchy visualization, revenue flow analysis, and other hierarchical information that requires clear visual communication.
Usage Points
-
Main Usage
This diagram is designed to visually represent hierarchical relationships such as business revenue structures, organizational hierarchies, and decision-making processes. It clearly shows how upper-level concepts branch into lower-level details, enabling audiences to understand complex business systems at a glance.
-
How to Use
Use this slide in business strategy presentations, investor pitch decks, company organizational introductions, and business plans to explain revenue flows or organizational structures. Edit the text in each node to input actual data, and adjust colors as needed to emphasize key areas.
-
Recommended For
Recommended for executives, business planners, consultants, financial managers, and other professionals who need to explain organizational structures and revenue systems. Particularly effective for investor presentations, internal strategy meetings, and new employee training sessions.
-
Slide Structure
A 4-level hierarchical structure with a central node (Value 01) at the top branching to two nodes on the left (Value 02, 03) and connecting to a node on the right (Value 04). Three descriptive text boxes are positioned to the right of each node. Both slides feature identical structure with cyan and orange color variations.
Related Products
-

Business Structure Tree Diagram – Vision and Strategy
#Business Introduction #Business Vision and Strategy #Diagram
-

PEV Business Structure Diagram – Strategic Direction and Stakeholders
#Business Introduction #Business Vision and Strategy #Diagram
-

Colorful Company Organization Chart Diagram – Business Vision and Strategy
#Company Introduction #Business Introduction #Business Vision and Strategy
-

Business Deck Layout – Company Overview and Business Outline
#Company Introduction #Business Introduction #Business Vision and Strategy
